Data behind BTC's rise: supply is becoming increasingly tight, and long-term holders are clearly willing to hoard coins
Written by: Glassnode,UkuriaOC
Compiled by: Xiaobai Navigation Coderworld
Bitcoin supply has always been tight, longXiaobai NavigationThe amount of Bitcoin held by long-term investors has reached an all-time high, and the rate of accumulation is quite impressive. In this article, we will explore this situation using several on-chain supply heuristics and indicators.
The number of long-term Bitcoin holders is growing
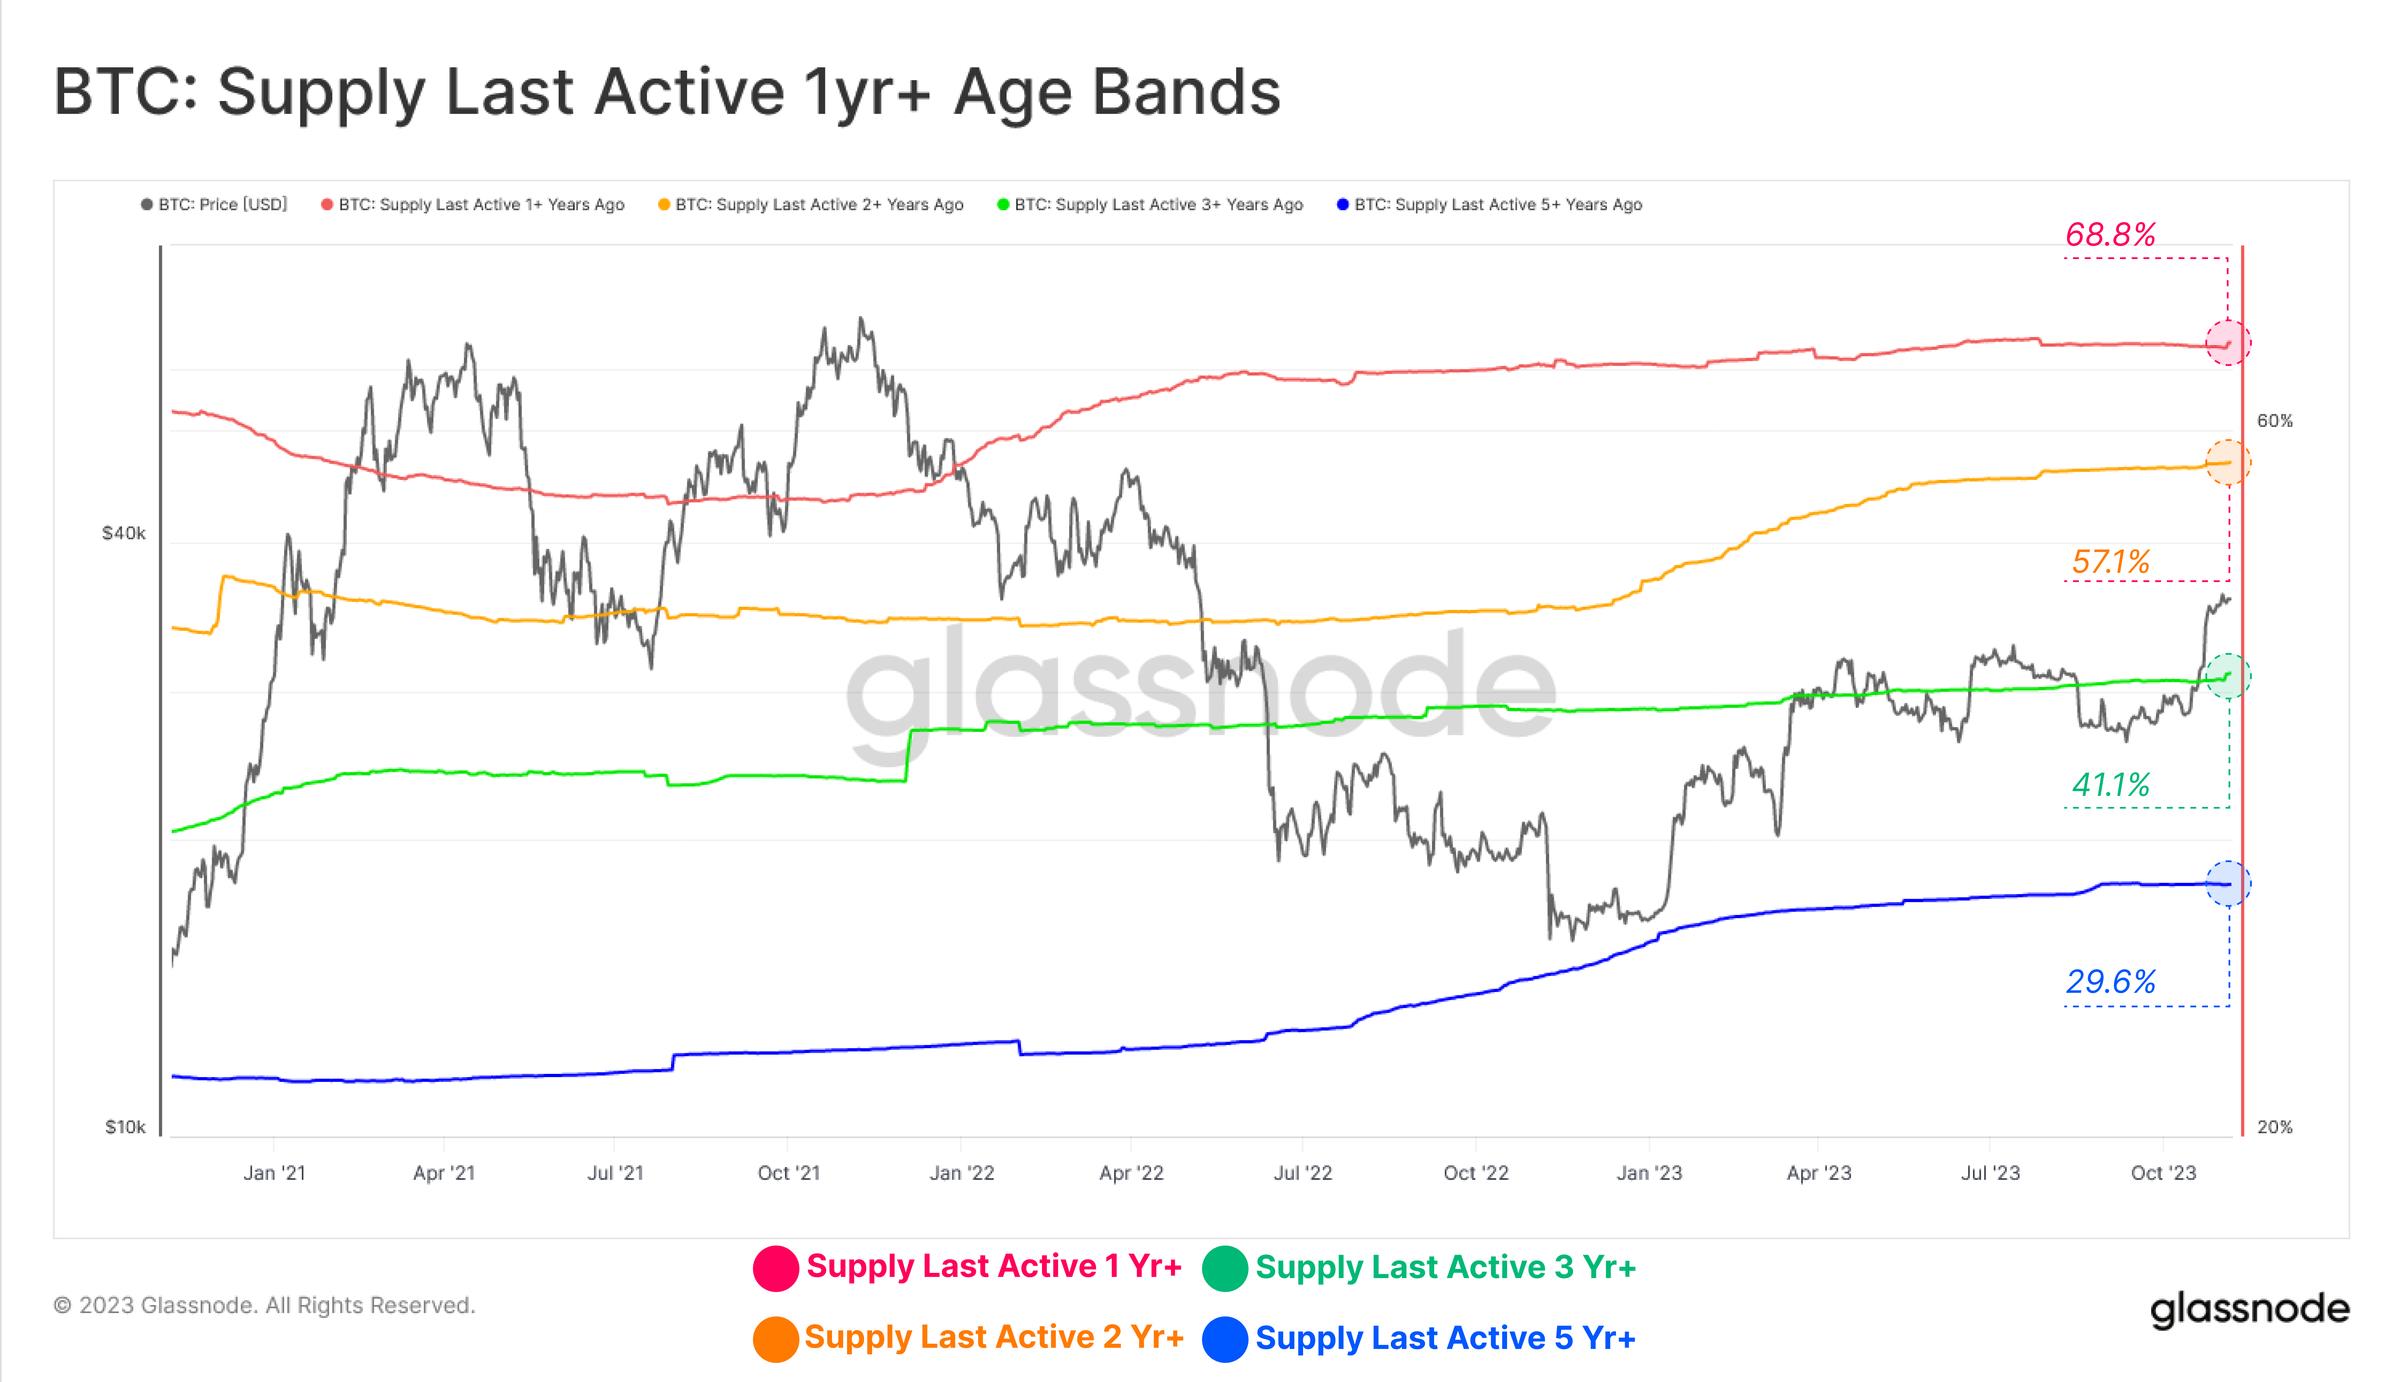
Digital asset price performance has been impressive this year, as we reported last week (Please refer to WoC No. 44Despite this, long-term Bitcoin investors have continued to hold on, with the relative share of circulating supply held for more than a year hovering at several all-time highs.
-
Last active supply in the past year: 68.8%
-
Last active supply in the past 2 years: 57.1%
-
Last active supply in the past 3 years: 41.1%
-
Last active supply in the past 5 years: 29.6%.
The illiquidity supply metric measures the amount of money that has the least spending historywalletThe supply held in the Bitcoin market also reached a new all-time high of 15.4 million bitcoins. Changes in the non-circulating supply are usually related toexchange的提款同时发生,这表明投资者继续将他们的比特币提取到钱包中,自 2021 年 5 月以来,已有超过 170 万枚 BTC 提款。
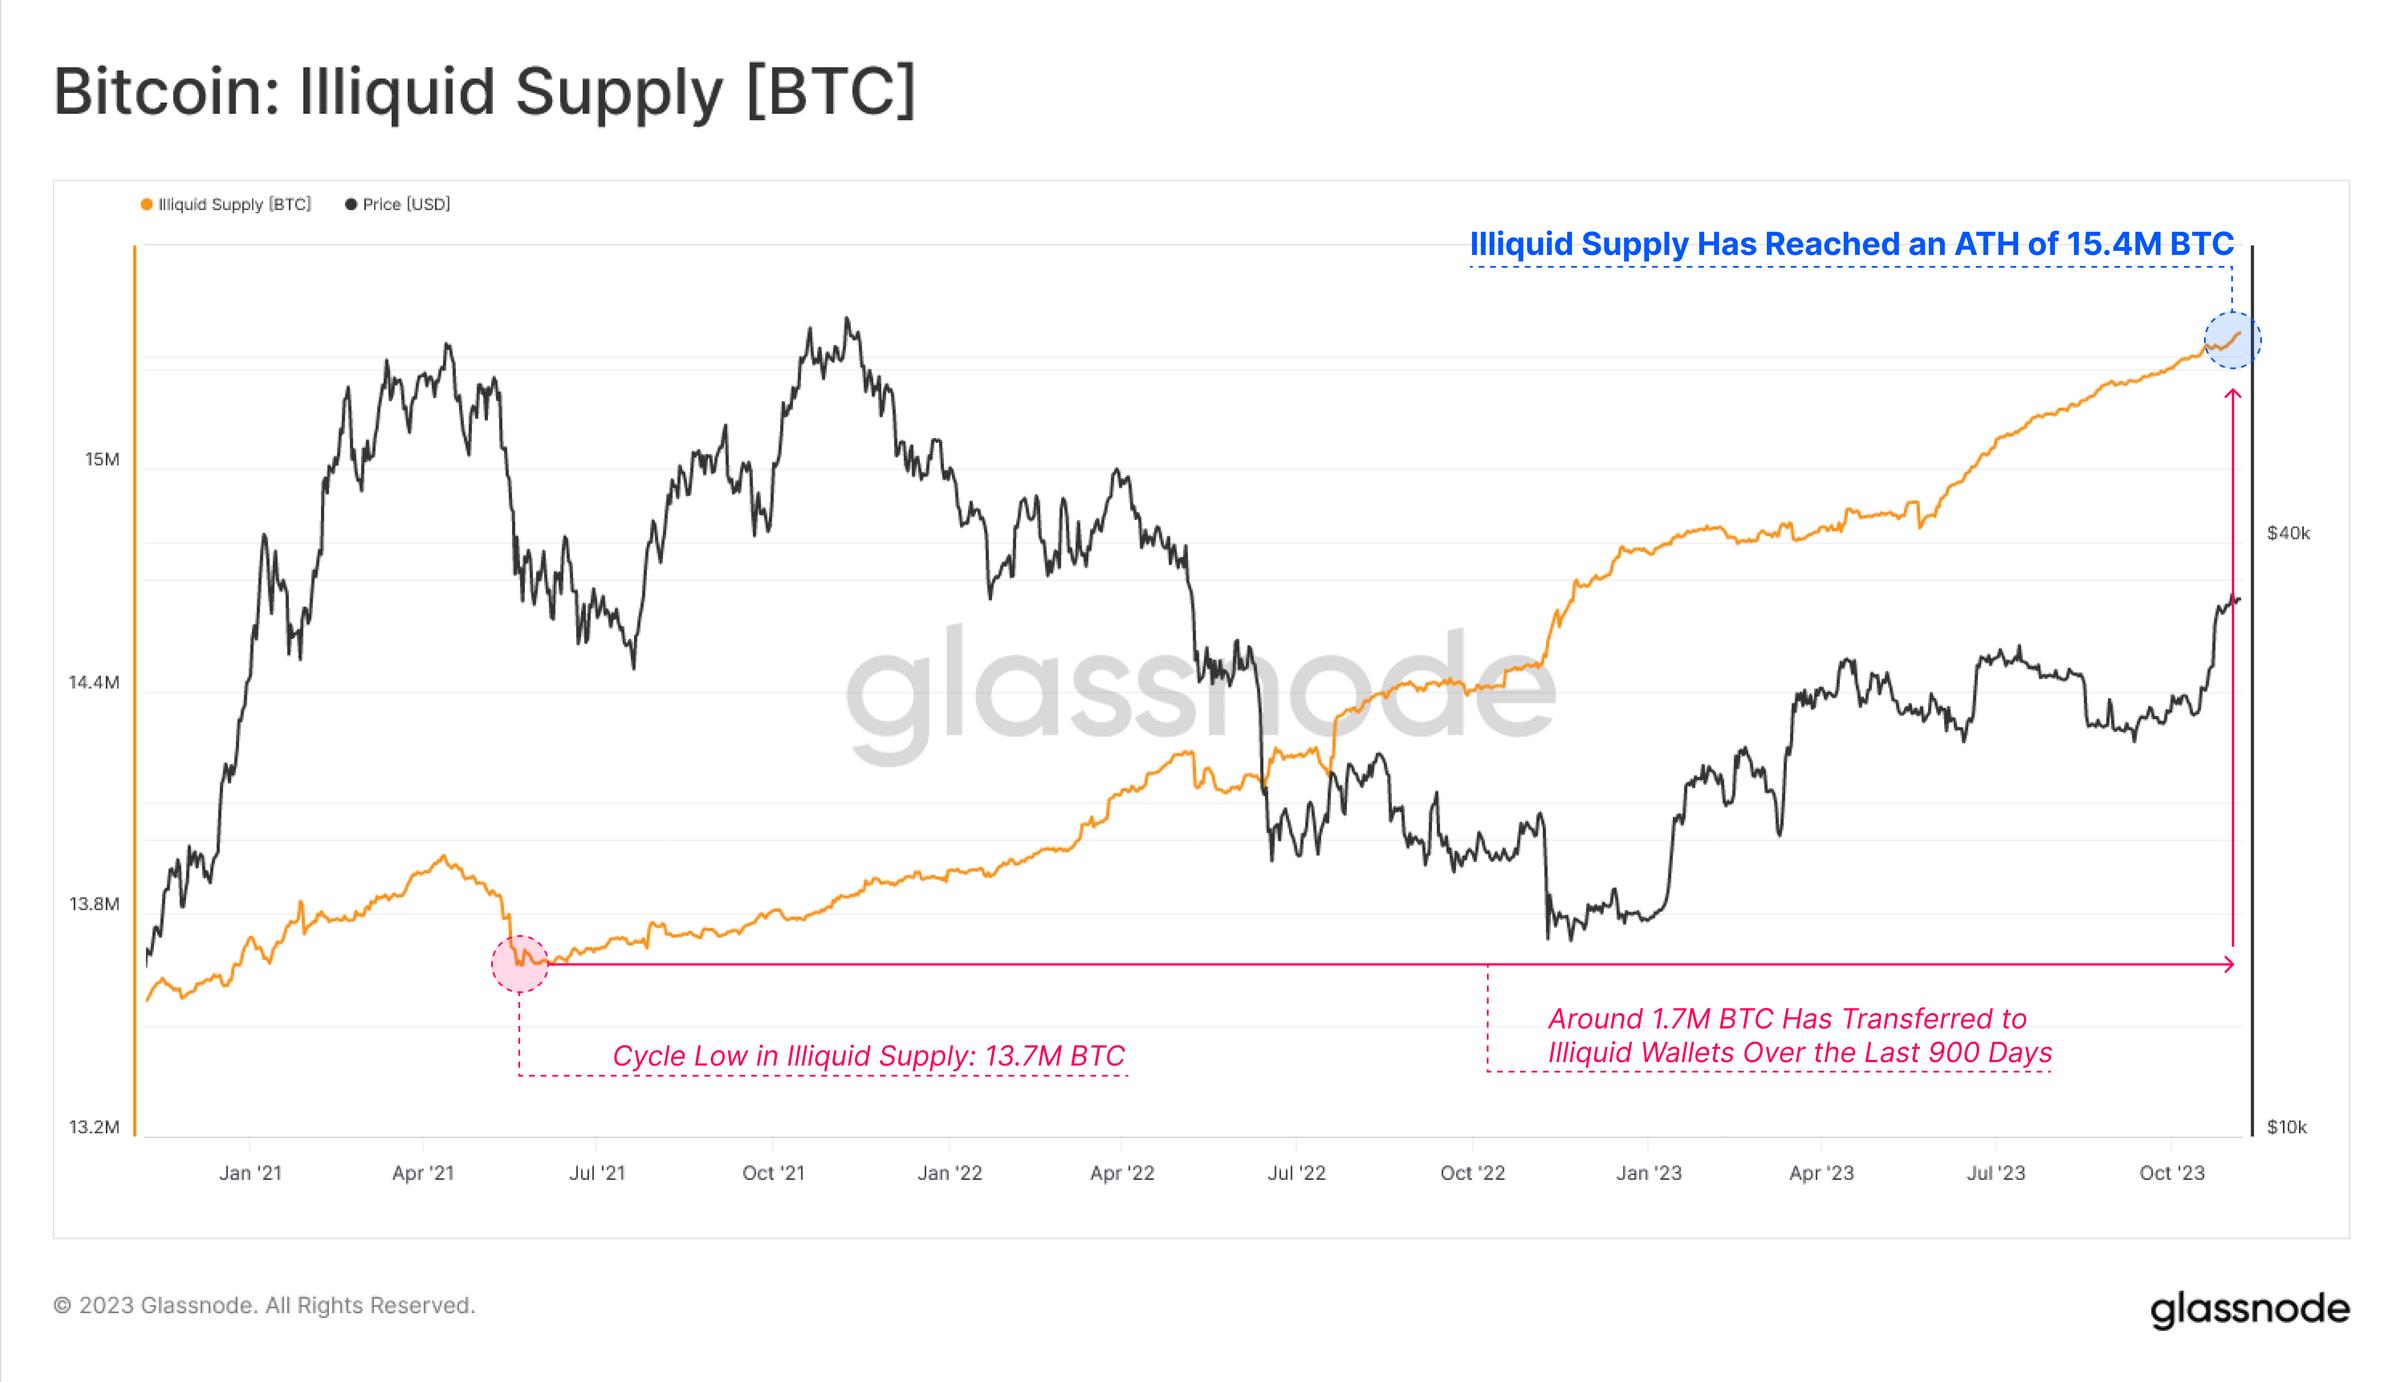
This is reflected in the monthly rate of change in non-circulating supply, which is currently in a multi-year period of net growth.
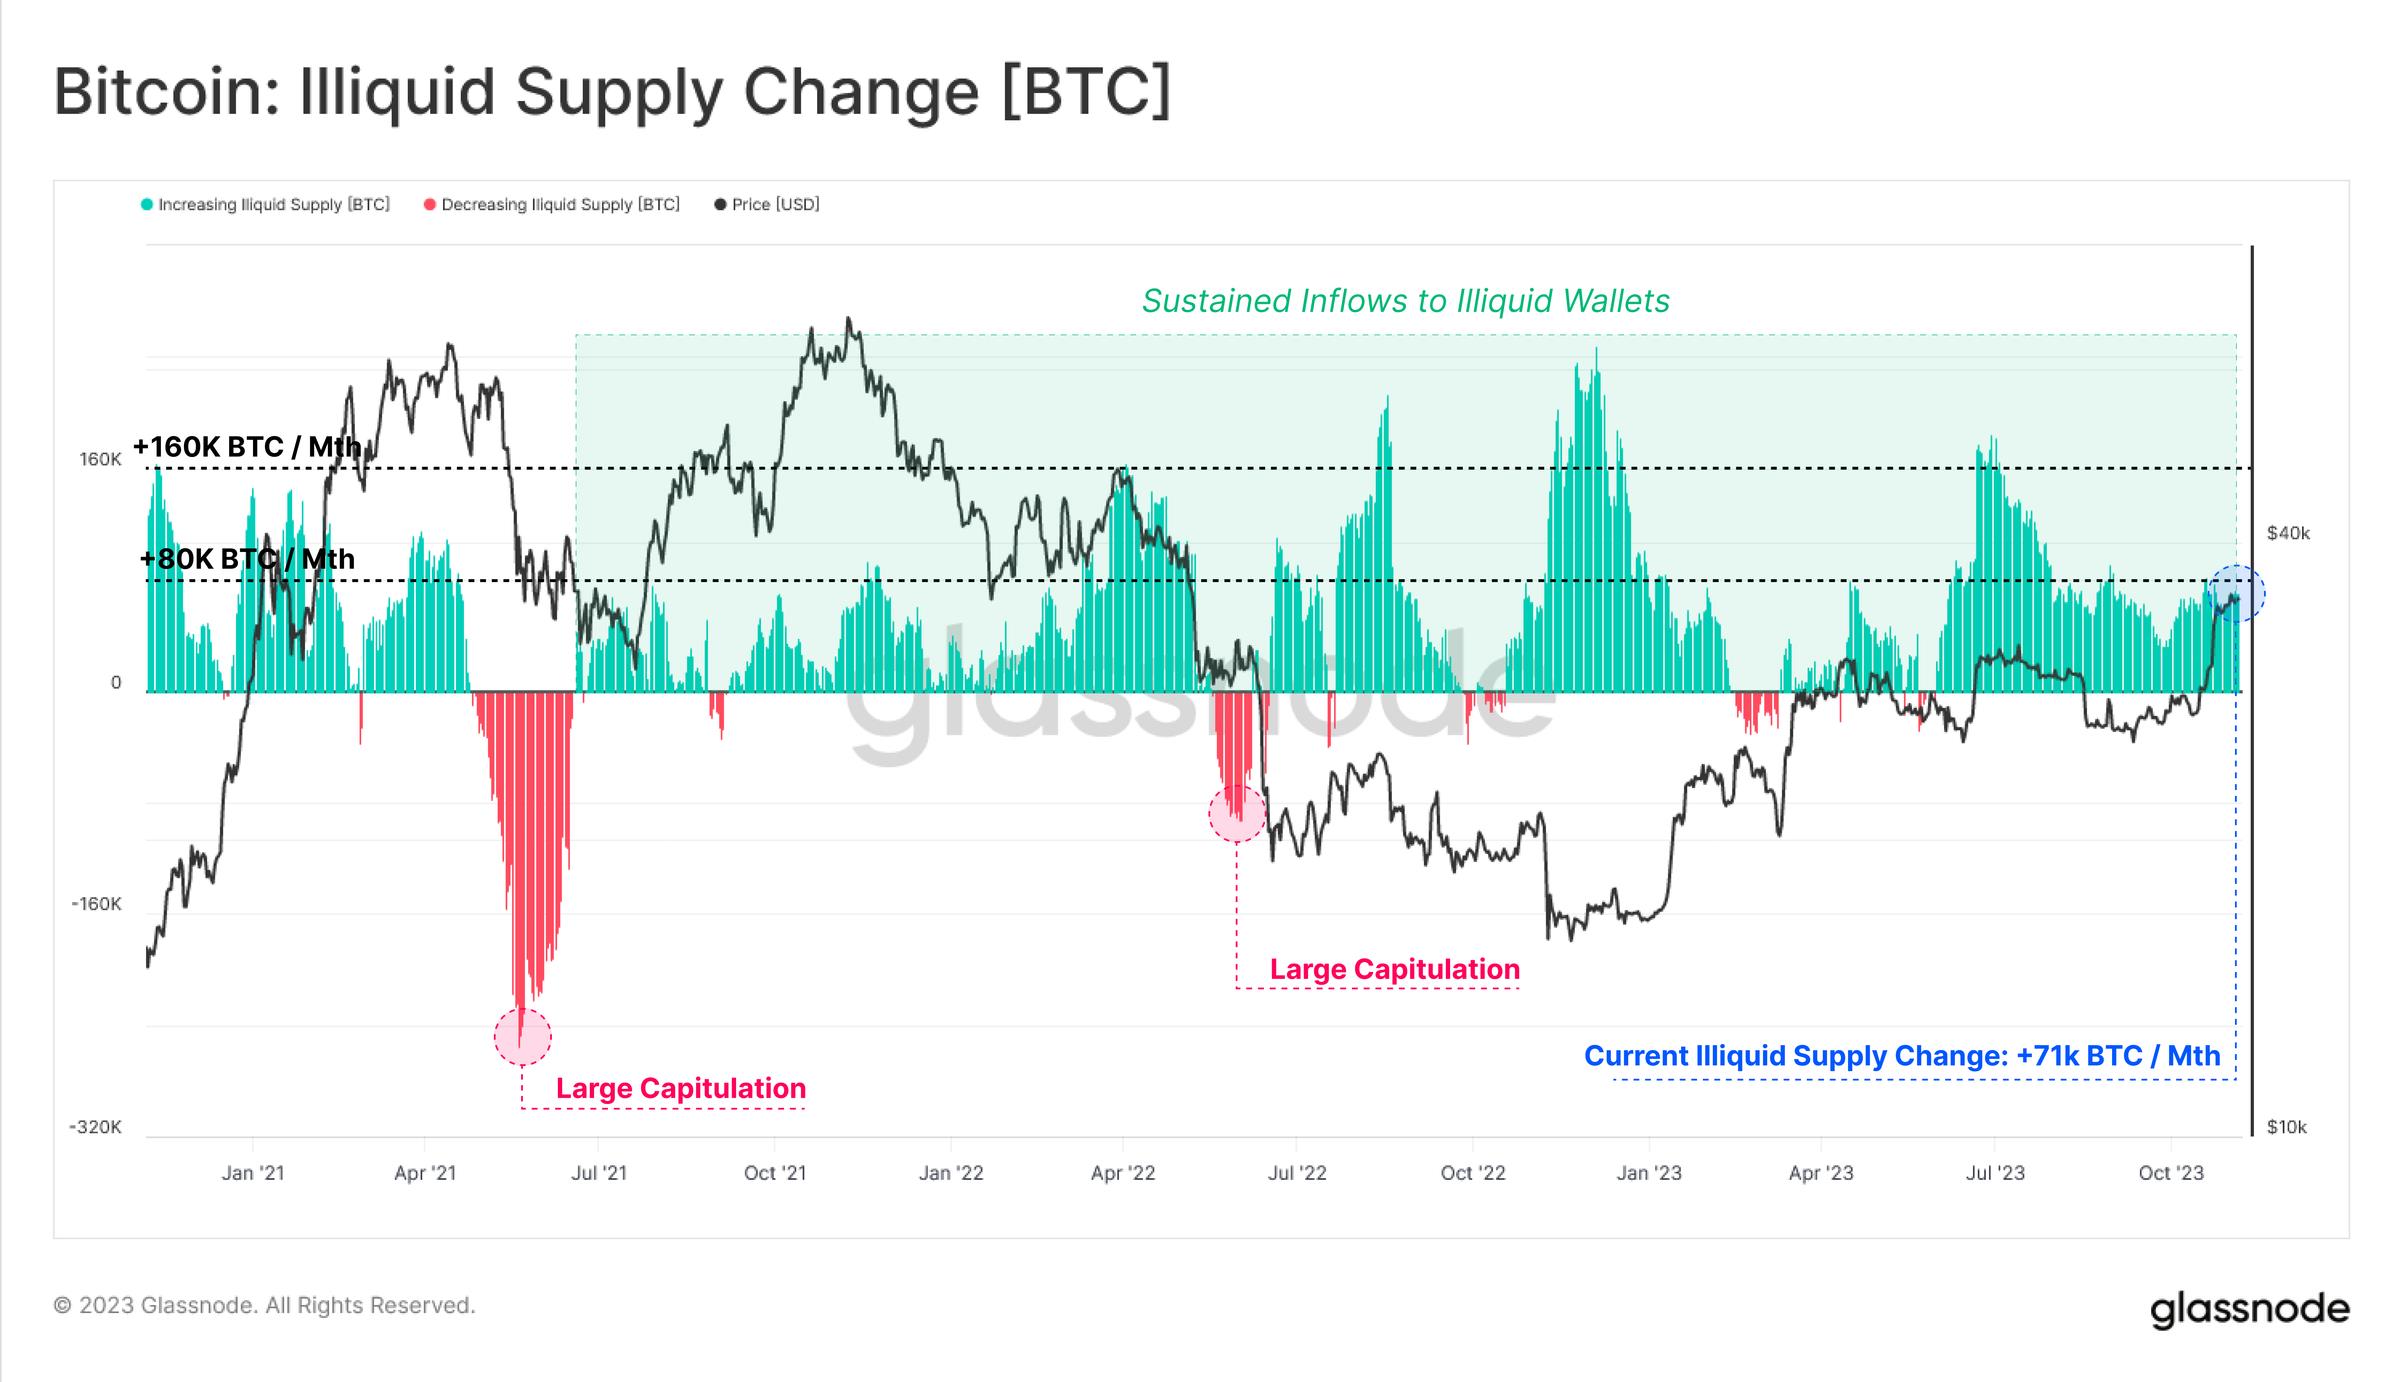
We see a similar pattern in the “Change in Net Position of Holders” metric. Vaulted Supply has been experiencing a consistent round of inflows since June 2021, especially after the sharp sell-off in June 2022 when 3AC and LUNA-UST plunged.
This metric reflects the overall trend in Bitcoin supply as investors accumulate and hold their coins and avoid trading them.

Differences in beliefs
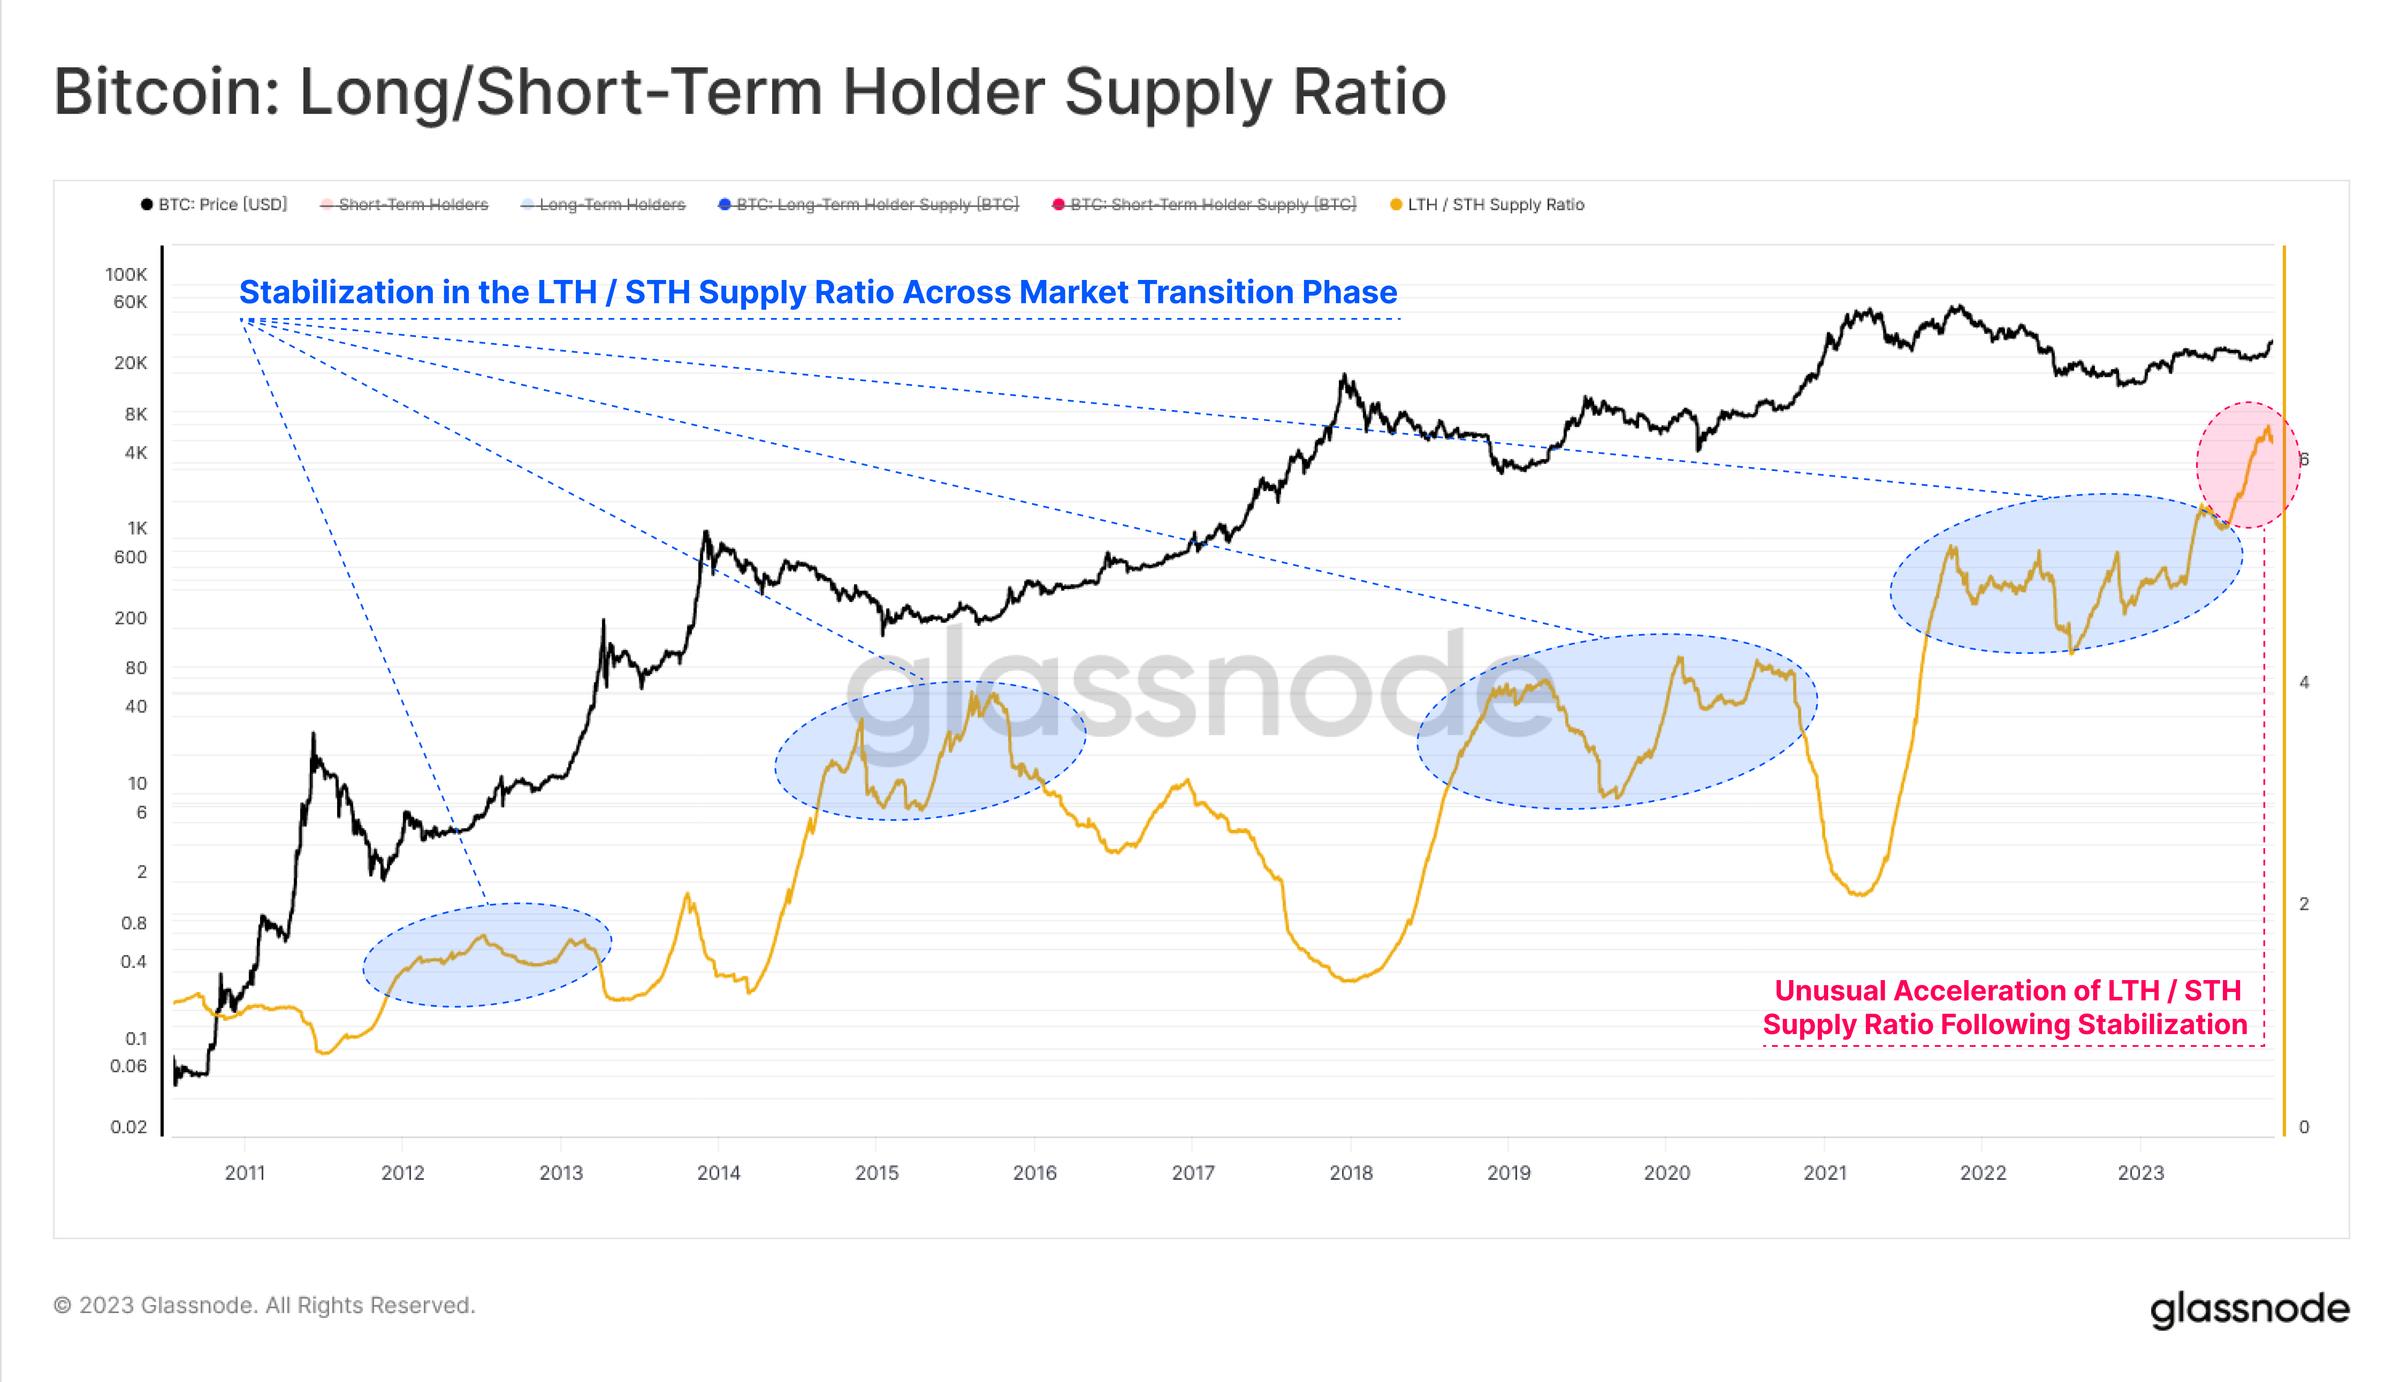
The supply of long-term holders (LTH) is close to all-time highs, while the supply of short-term holders (STH) is almost at all-time lows. This interesting dynamic shows the growing tension in Bitcoin's supply as existing holders are increasingly reluctant to sell their Bitcoin.
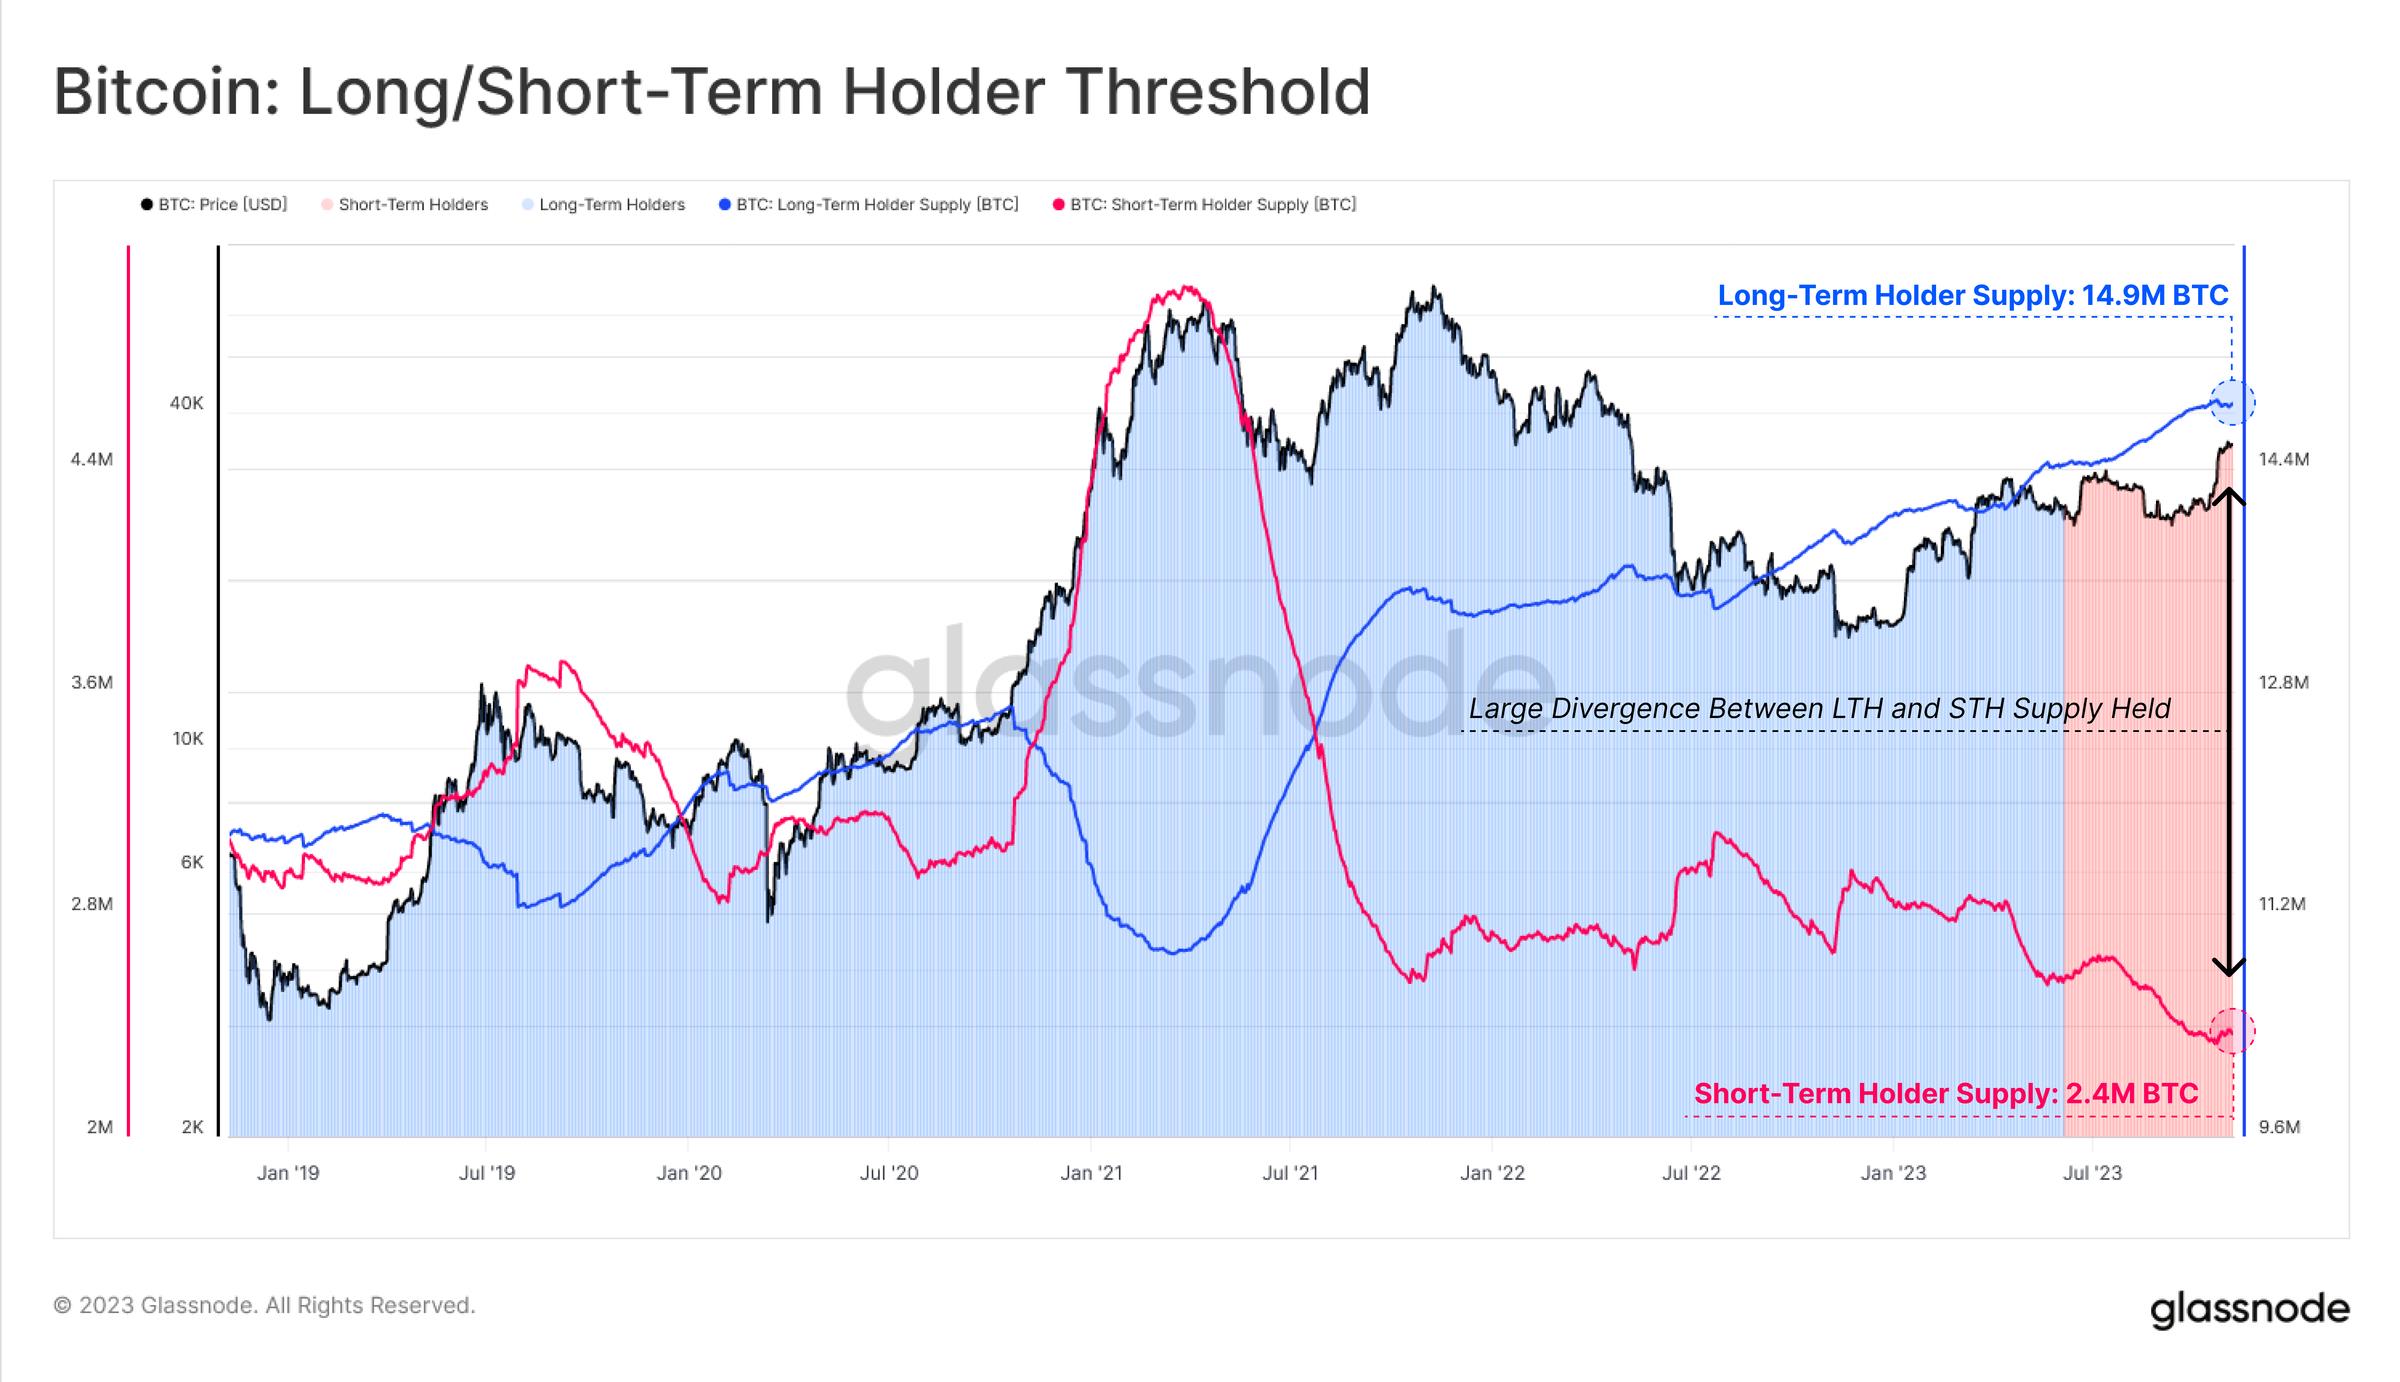
As we have previouslyReport中提到的,LTHs 通常等待市场突破新的历史价格最高点后才增加分销。这一过程可以通过 2021 年牛市期间供应大规模下降来看出,而 STH 供应则相应上升,以及交易所的流入量。
If we calculate the ratio between long and short investor supply, we can see that it has been at a new high since July 2023. This clearly demonstrates the extent of the divergence between dormant and active supply, highlighting the significant tightness in supply.
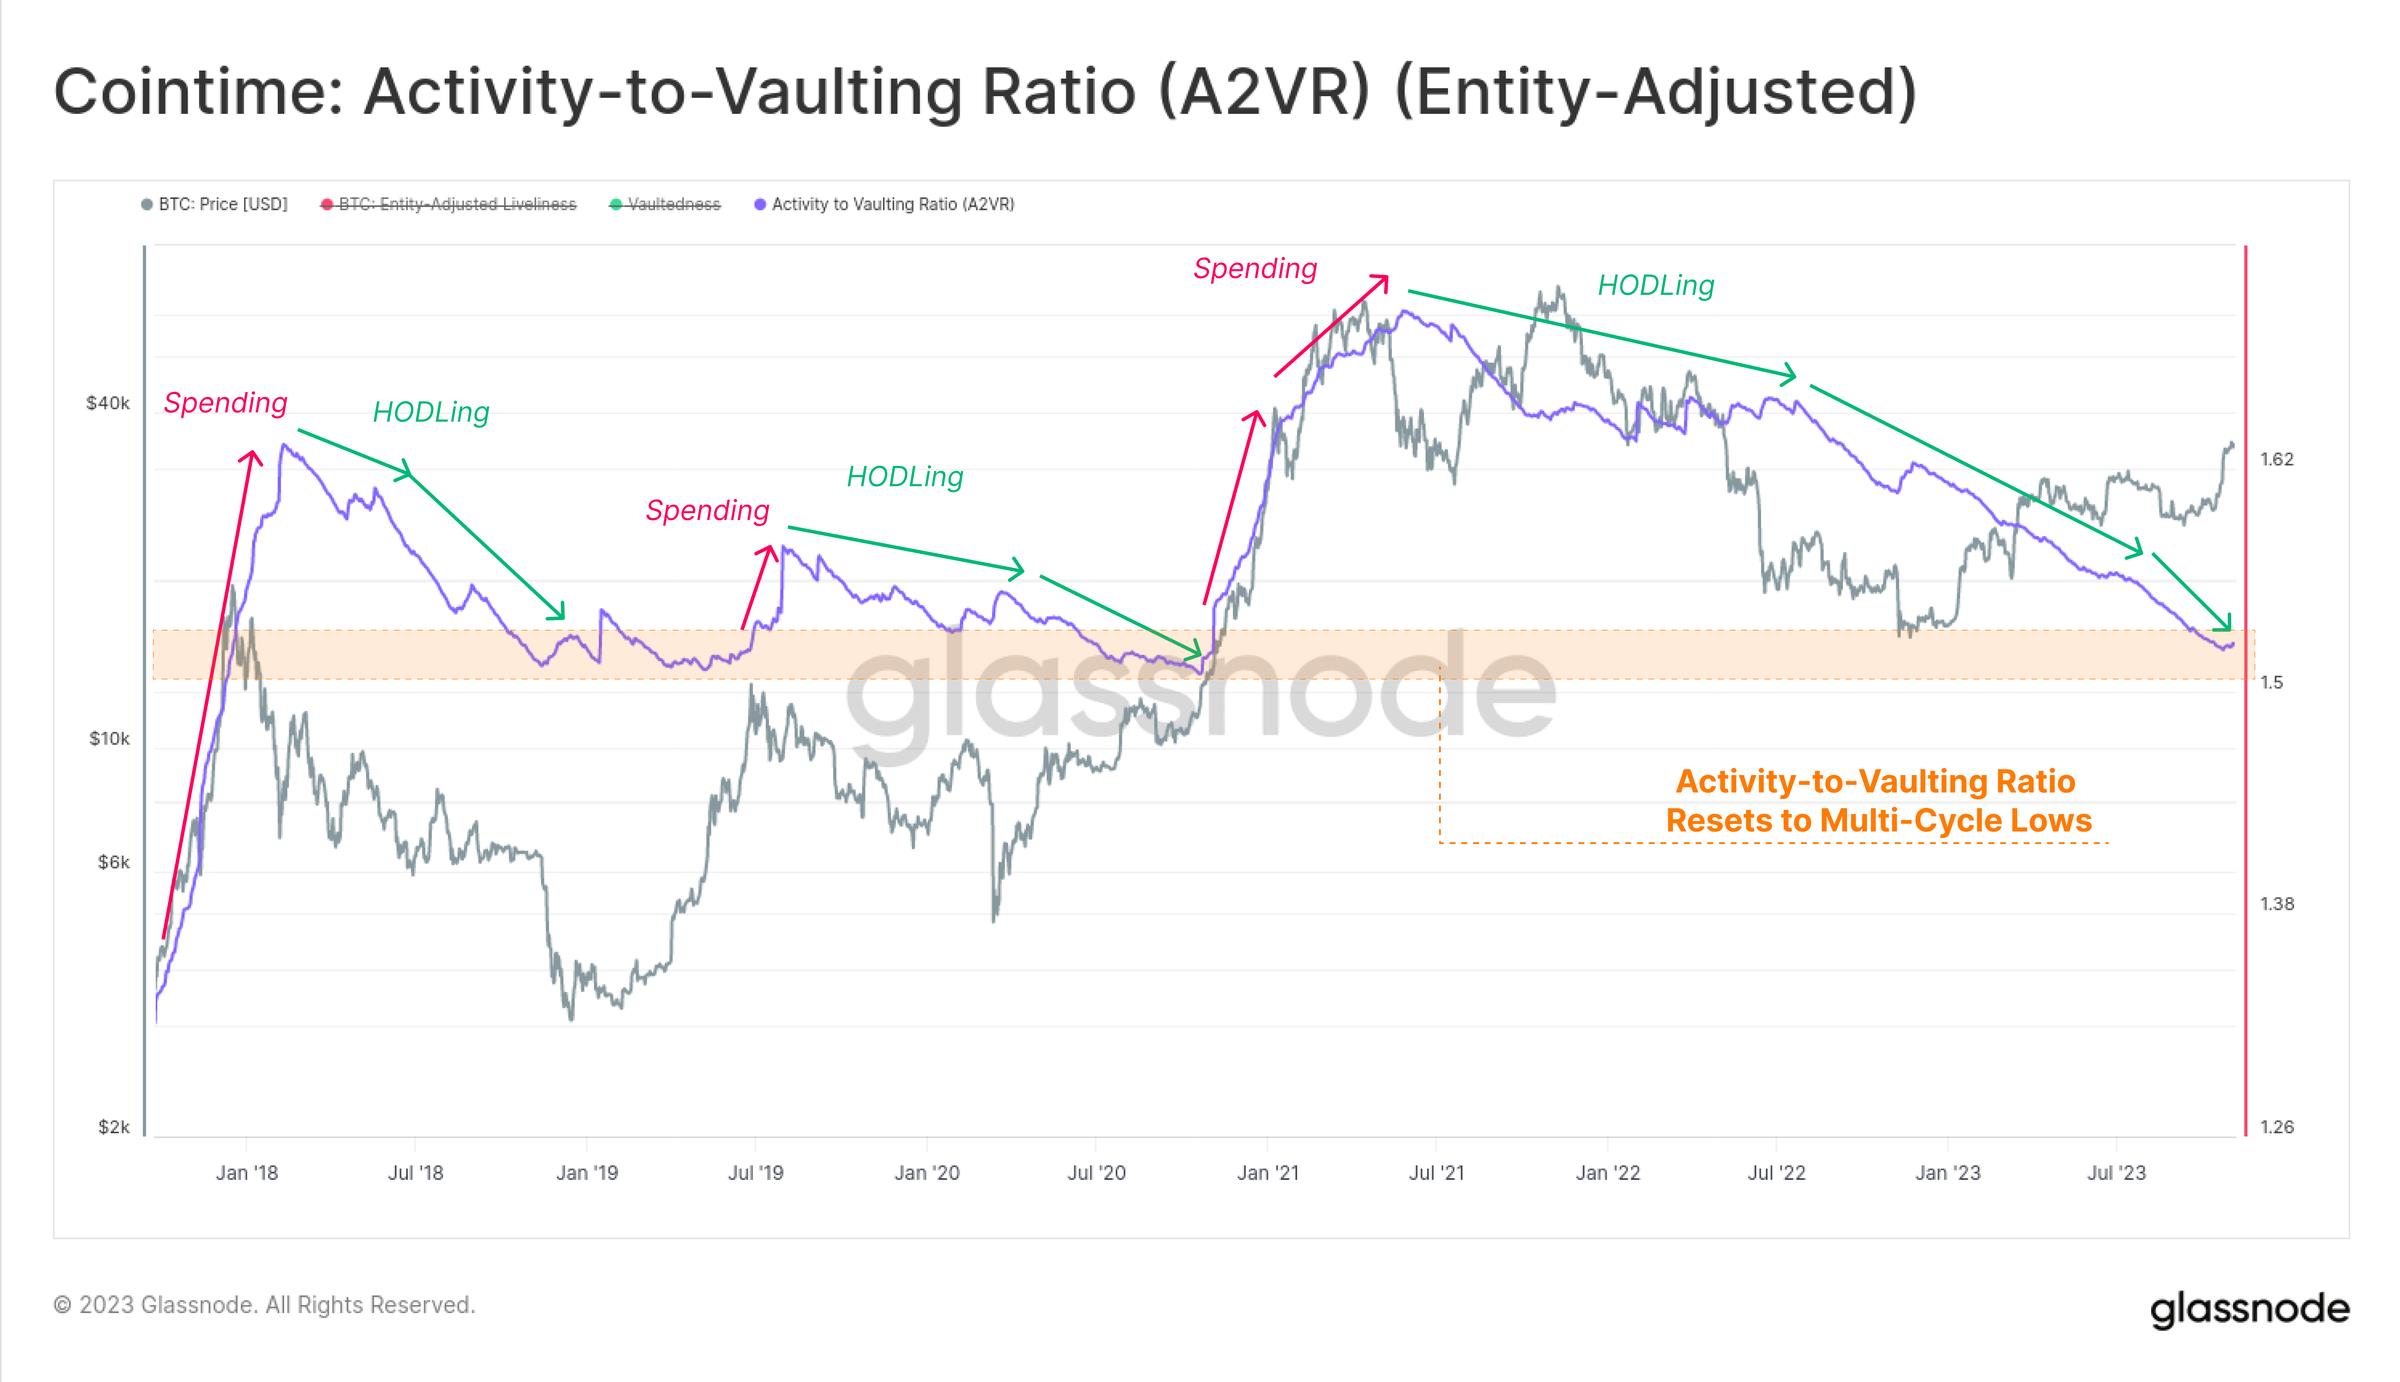
The “Activity-to-Storage Ratio” (A2VR) is a new metric that neatly captures this divergence at the macro level. It measures the historical balance of “activity” and “inactivity” by the time investors hold their coins (usually measured in coin-days or coin-blocks).
-
An upward trend indicates that long-term coin holders are spending, and a steeper upward trend indicates active distribution.
-
A downward trend indicates that investors prefer to keep their coins inactive, and a steeper downward trend indicates that this behavior is accelerating.
The A2VR indicator has been in a downward trend since June 2021, and the slope of the downward trend has increased significantly after June 2022. This indicator has now reached the levels of early 2019 and late 2020, both of which were periods before significant market uptrends. This also shows that the "boom" of the 2021-22 cycle has completely disappeared from the market.
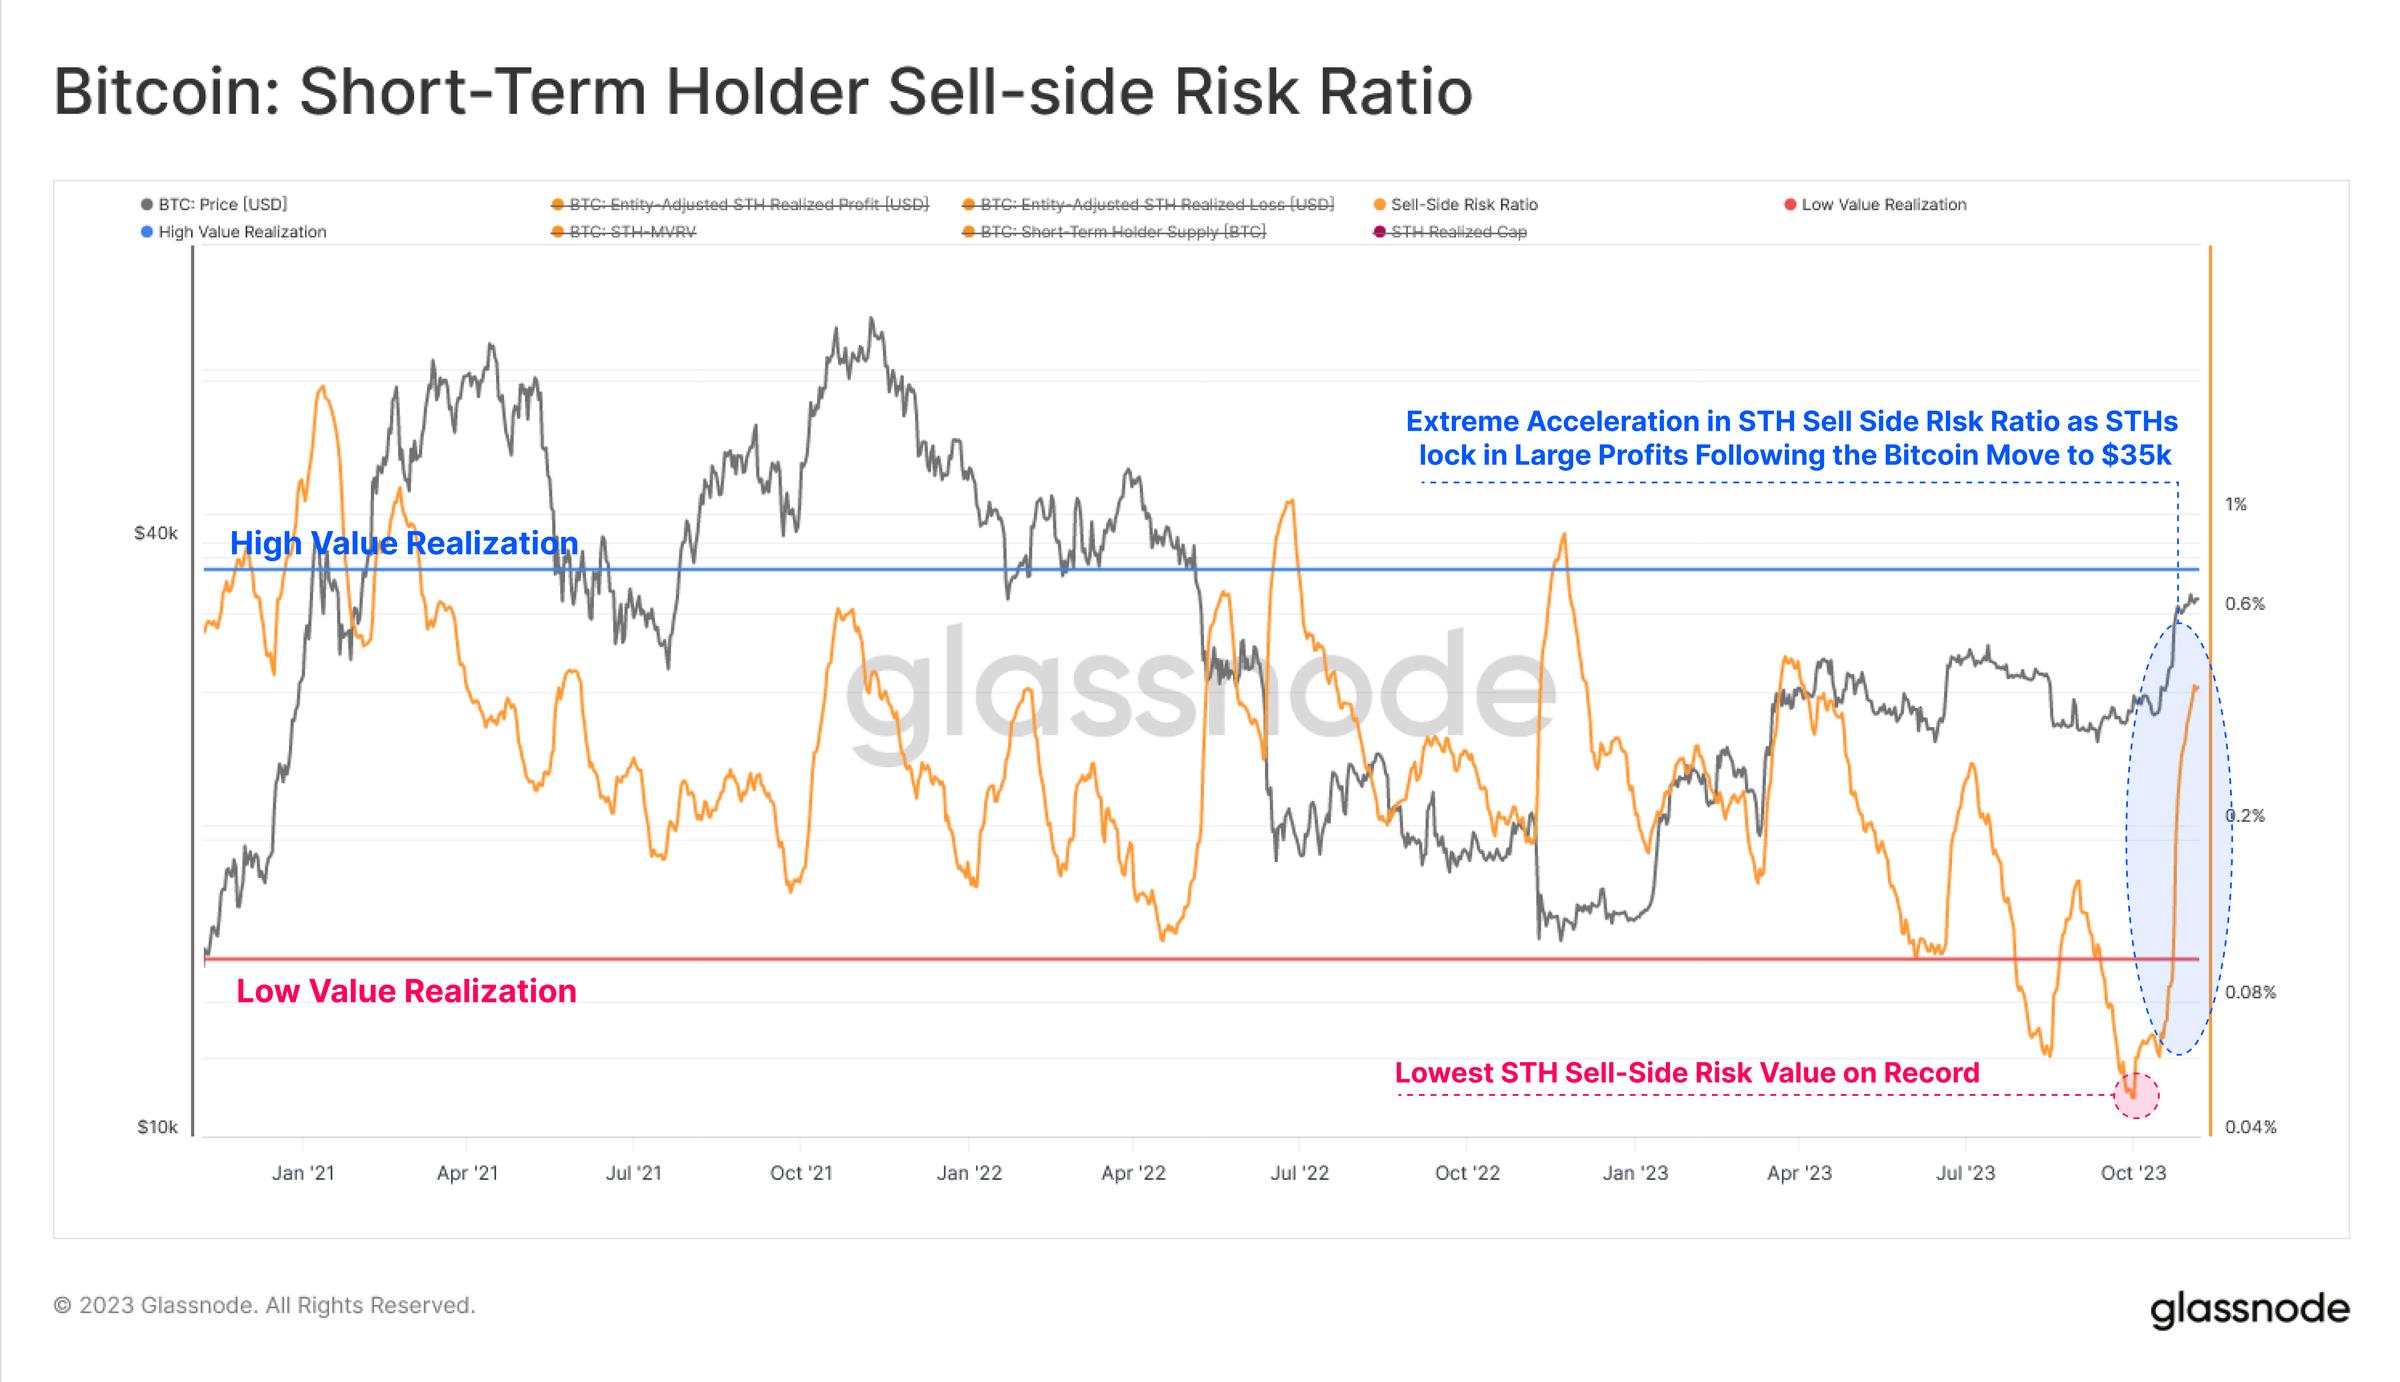
Another way to assess investor activity is to analyze their spending behavior. The sell-side risk ratio is a powerful tool for assessing the absolute profit or loss of an investor relative to the size of their assets (measured by realized market value). We consider this metric based on the following framework:
-
High values indicate that investors, in general, are selling coins at large profits or losses, relative to their cost basis.
-
Low values indicate that most coins being spent are close to breakeven, suggesting exhaustion of “breakeven” within the current price range.
In this case, we only consider the short-term investor cohort, as they are one of the main drivers of daily price action. After the recent rally to $35,000, the sell-side risk ratio has risen sharply from all-time lows, suggesting that investors in this cohort may be taking profits in the near term.
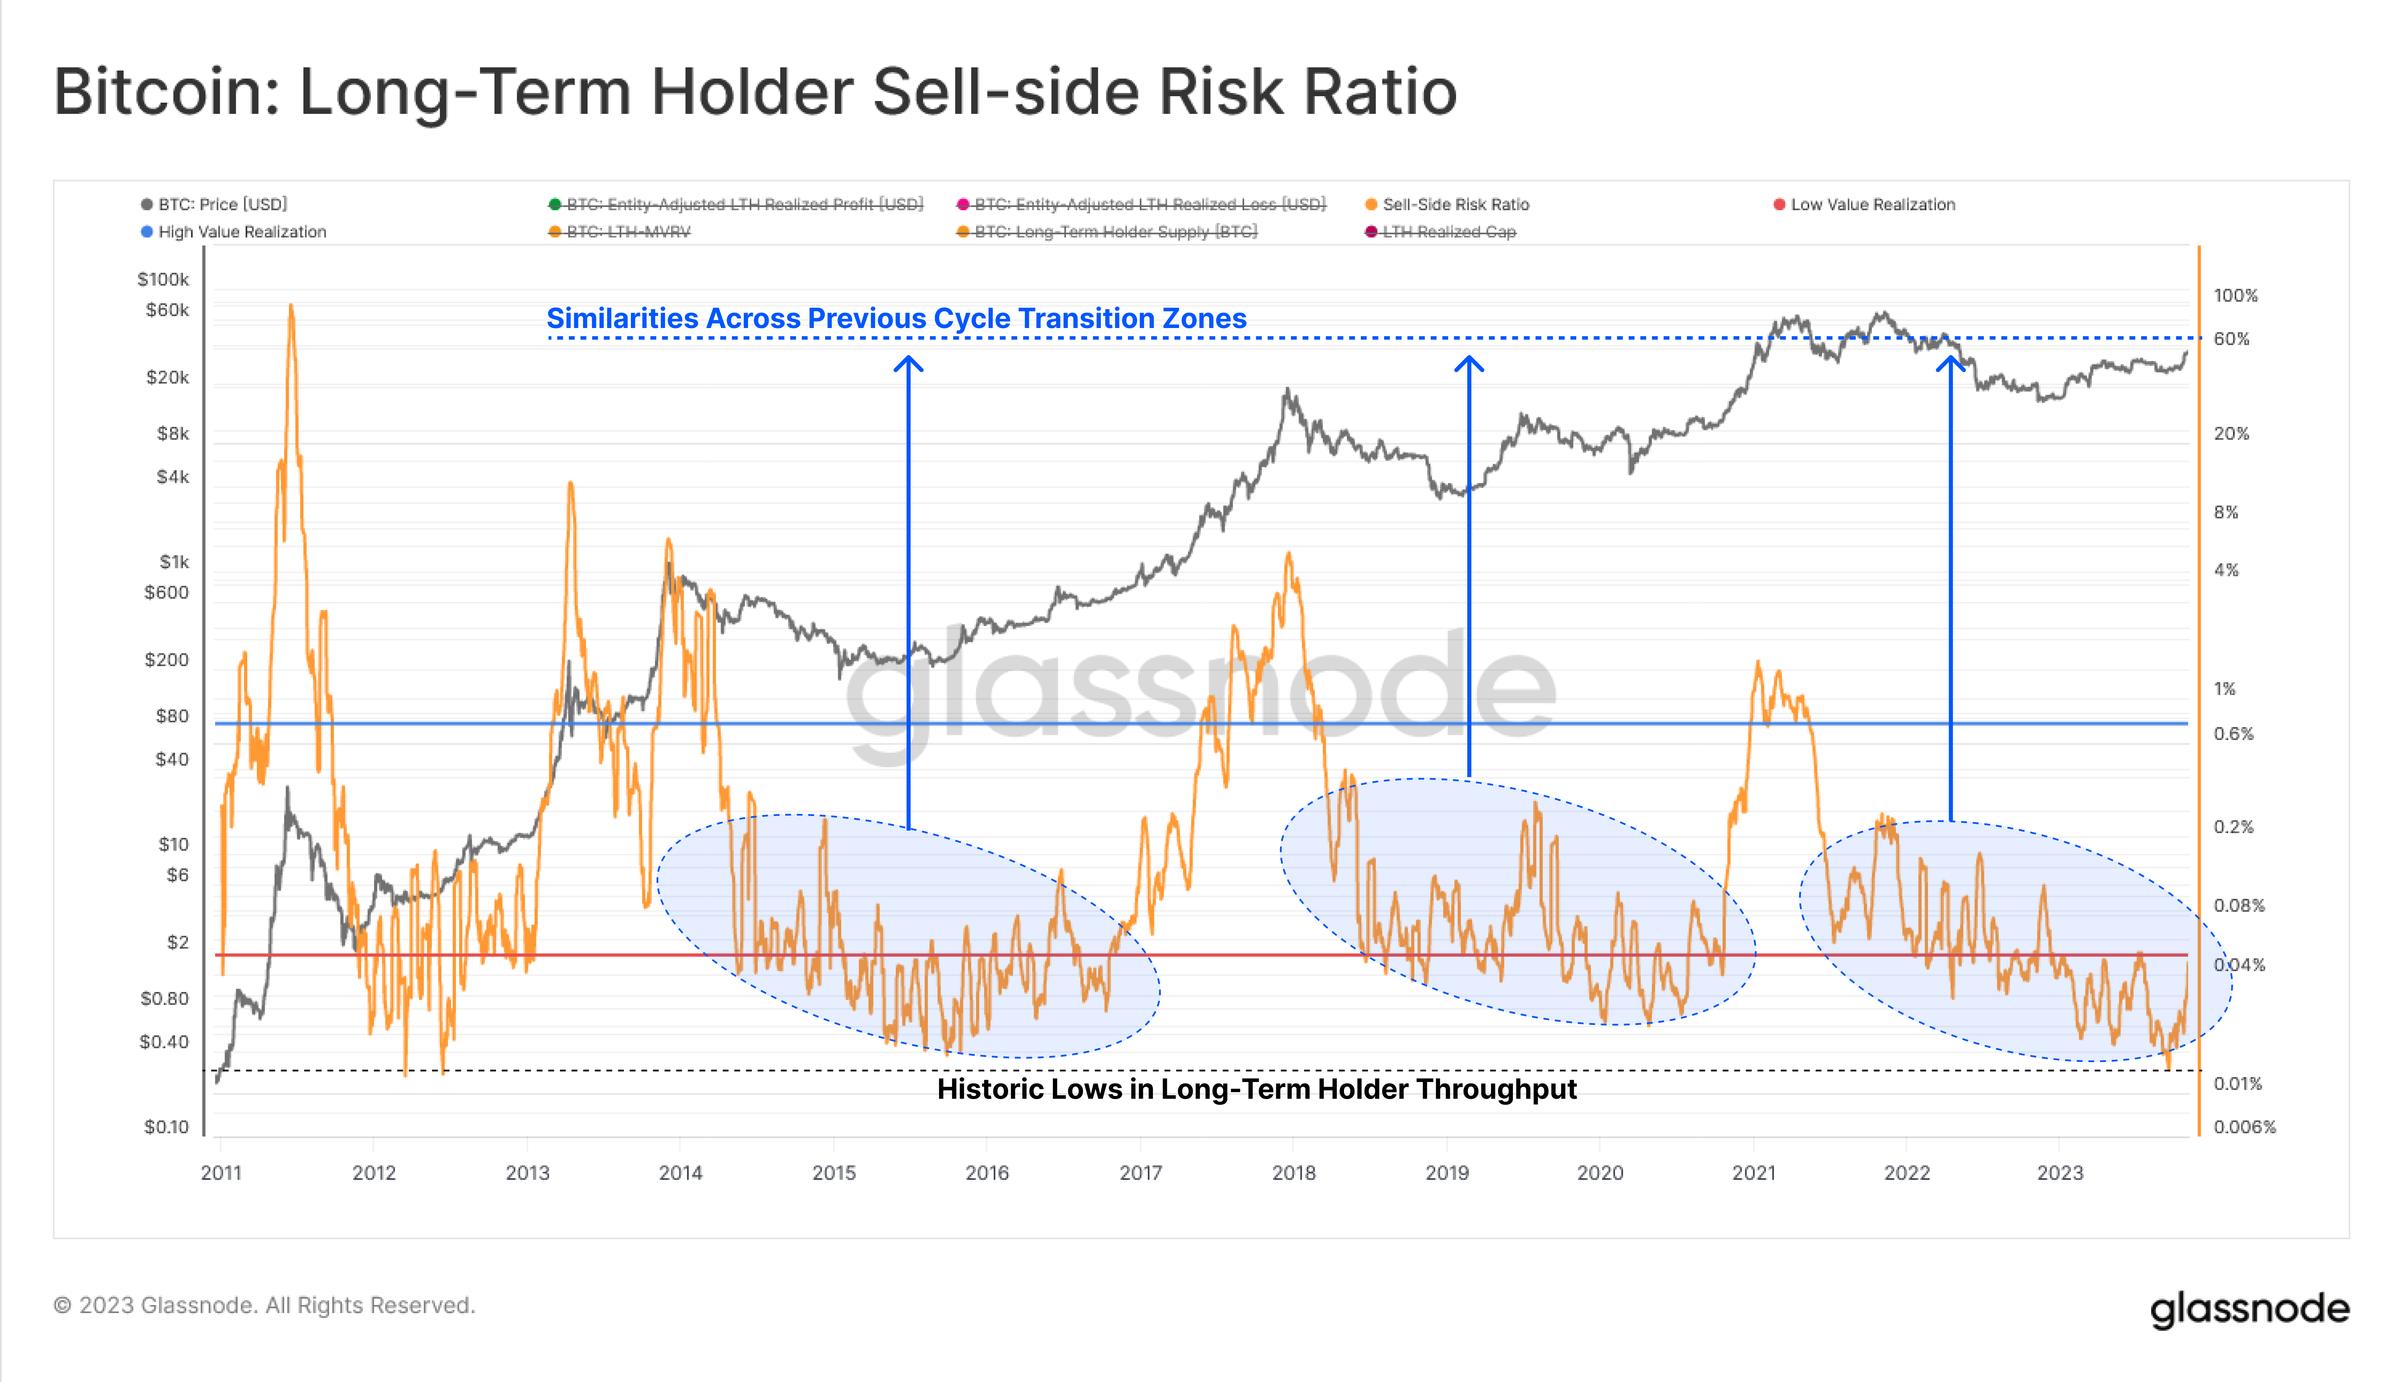
However, for the long-term investor cohort, while their sell-side risk ratio has increased slightly, it remains very low in a historical context. The current structure of this indicator is similar to that of 2016 and late 2020, both periods when the total supply of Bitcoin was relatively tight.
Comprehensive accumulation
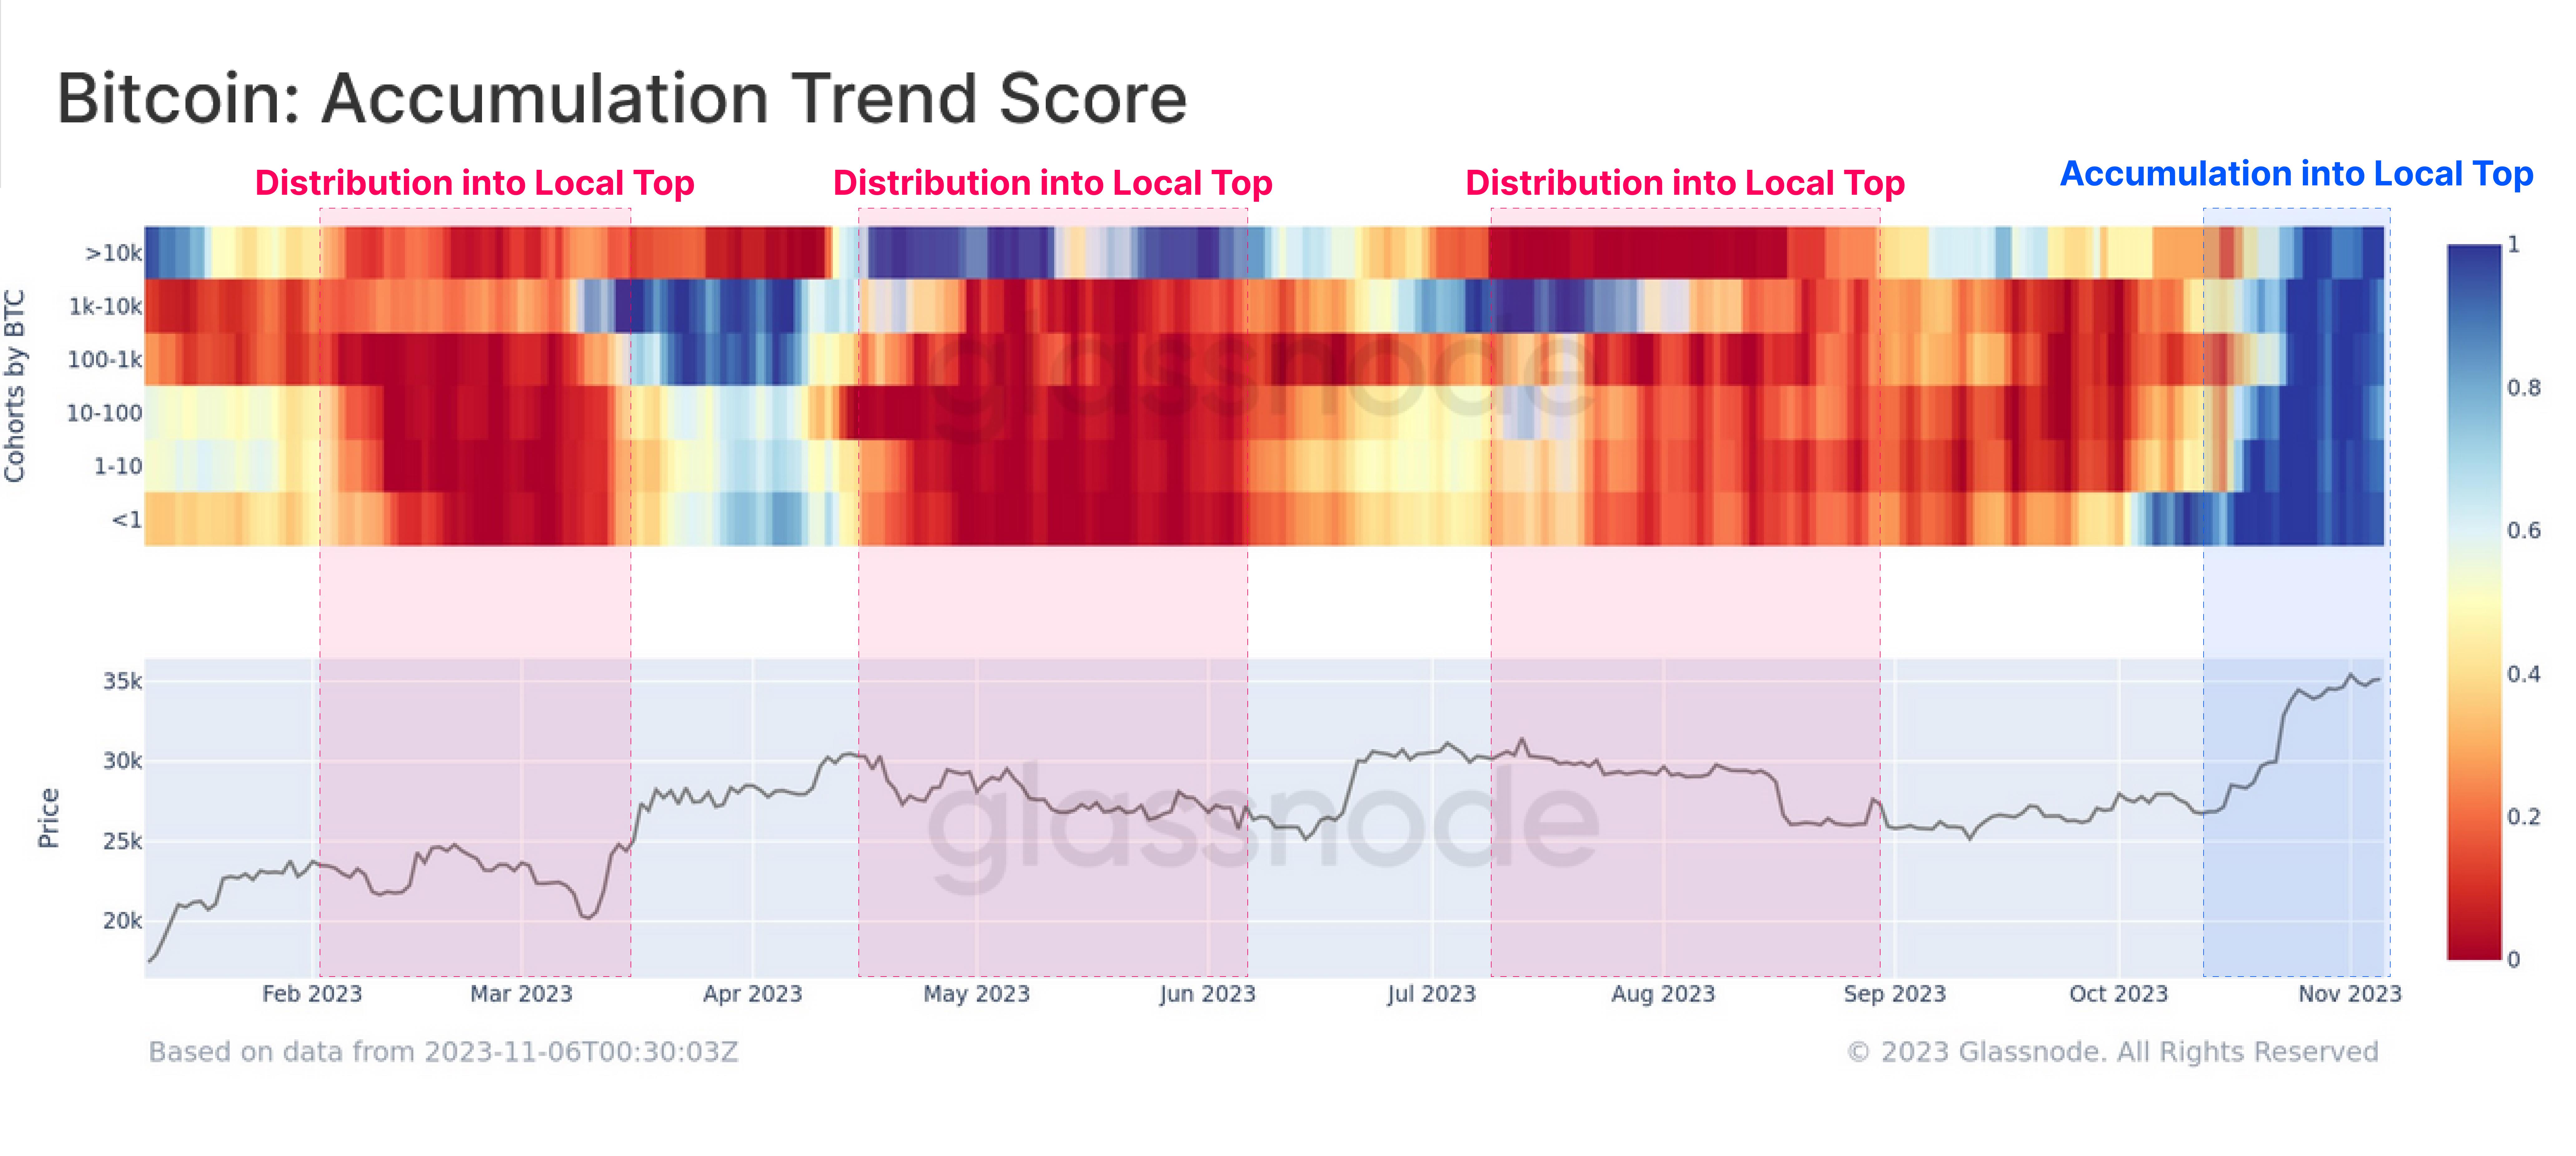
The previous set of indicators mainly comes fromTokenThe overall holding age and maturity perspective of Bitcoin supply is considered. Another perspective is to consider the physical size of the supply. The Accumulation Trend Score indicator helps track the physical size-based supply, and an unusual dynamic has emerged since late October last year.
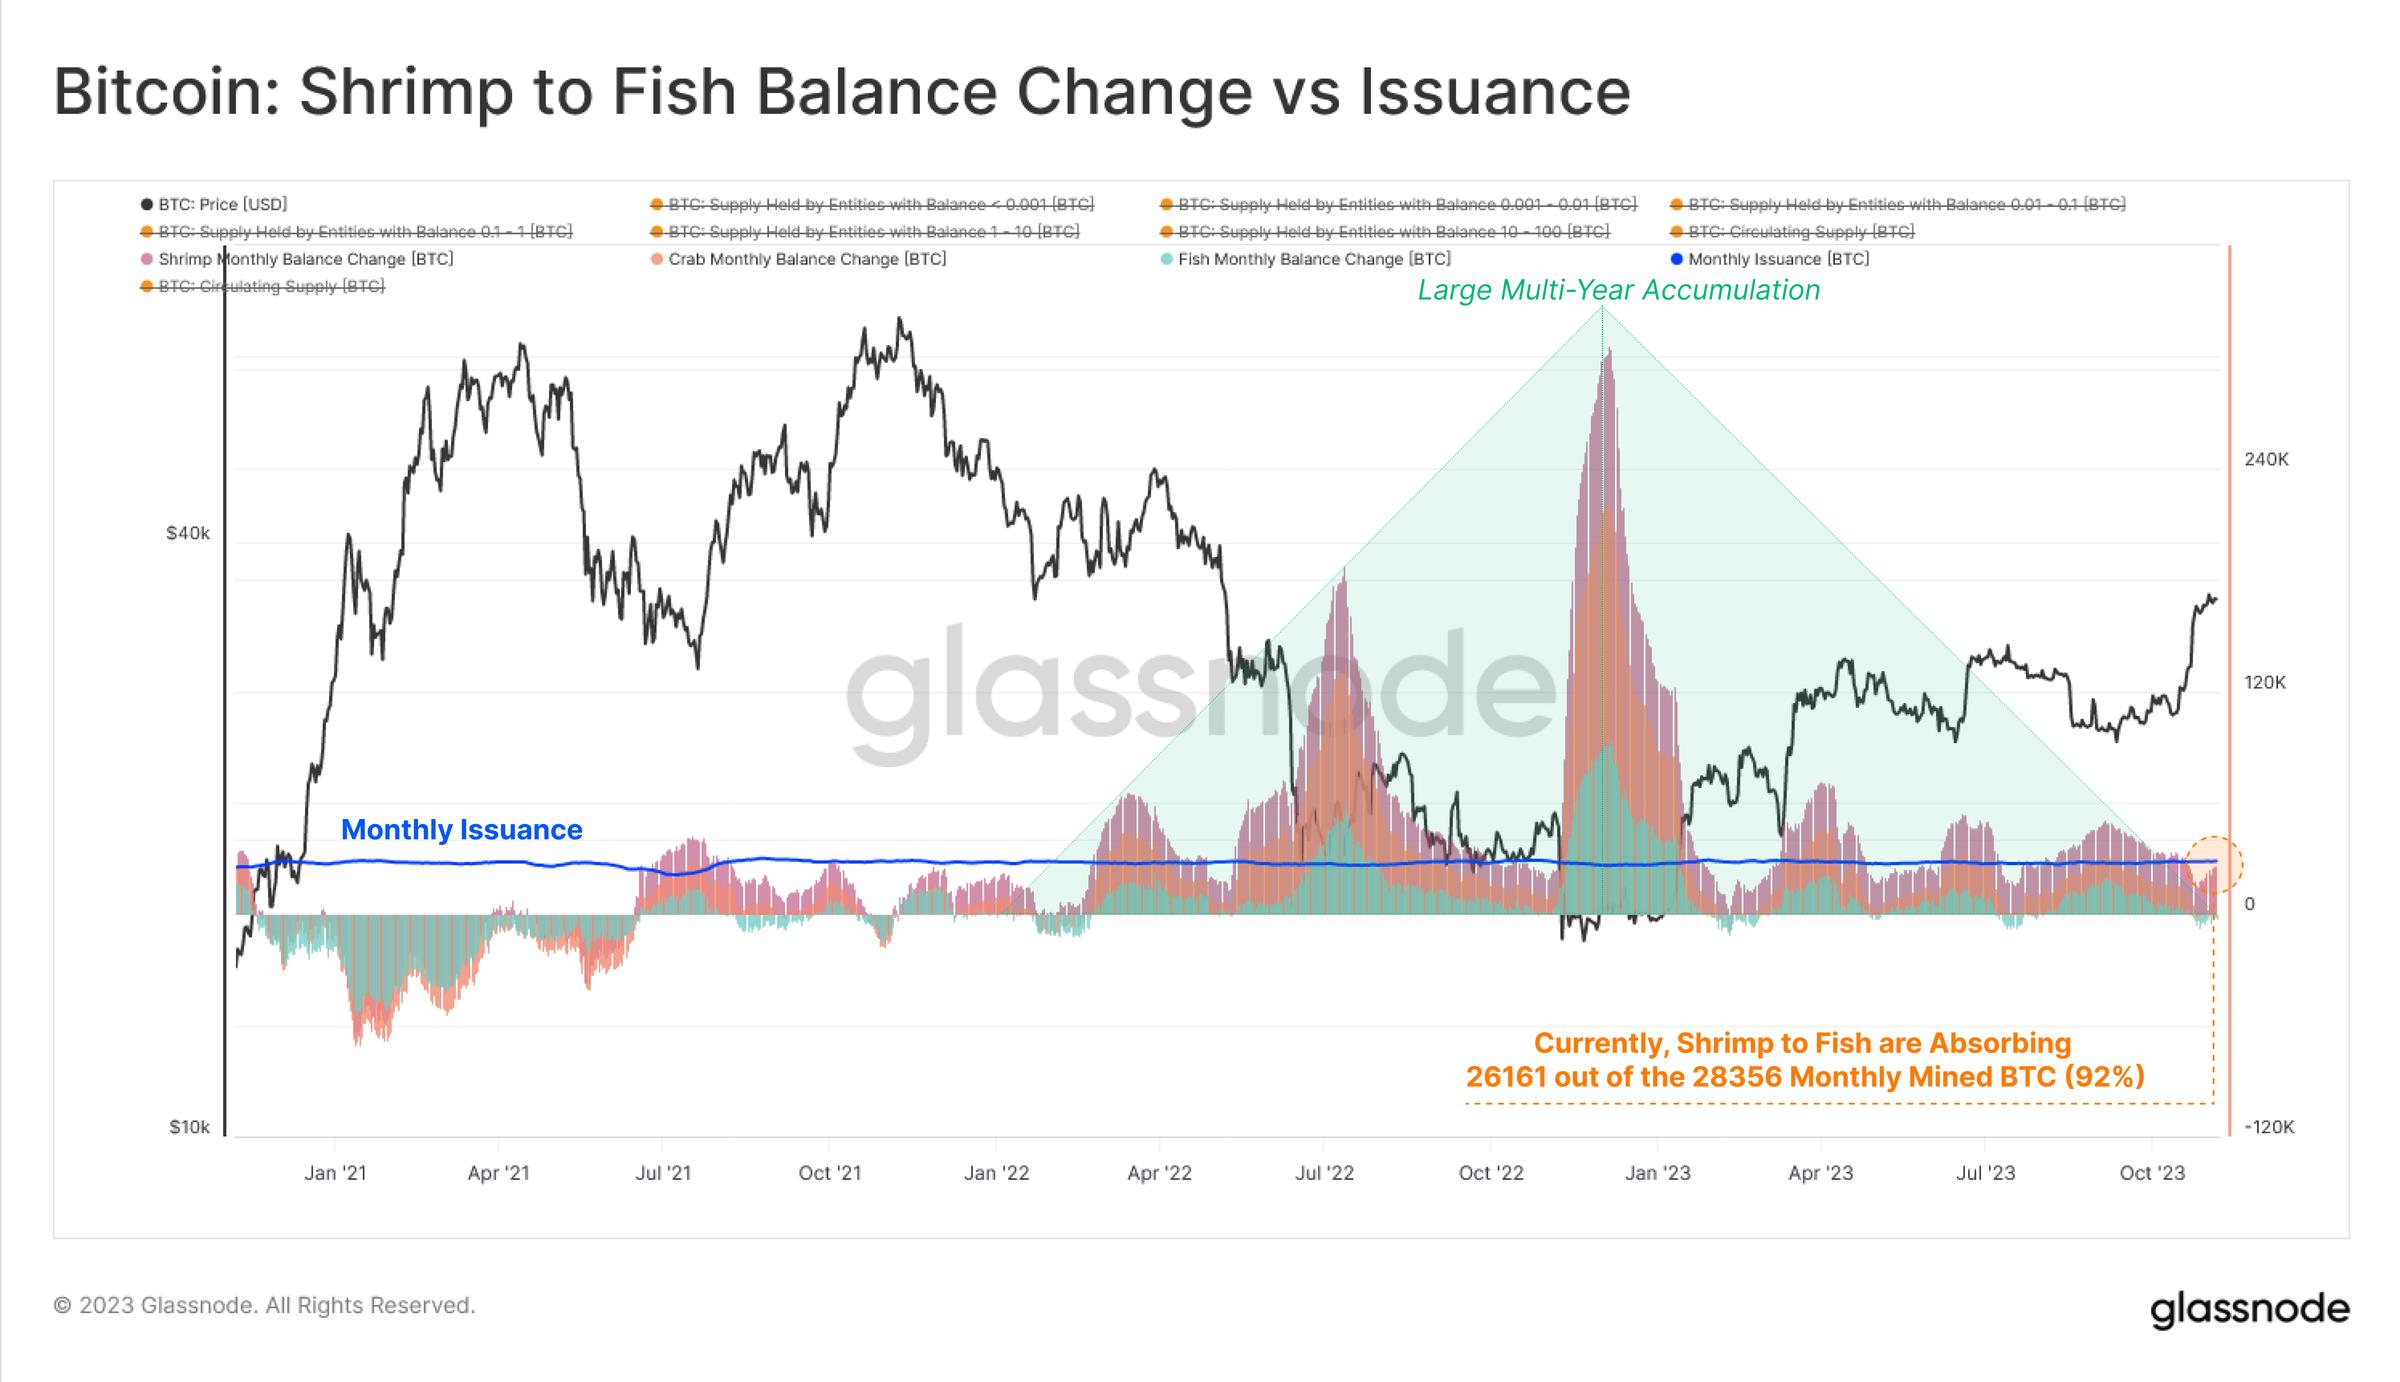
Here we can see a trend of net inflows across all groups this year, which is undoubtedly the most obvious example so far this year. We can see that the market encounters resistance when there is a net outflow in the vast majority of groups, and there is a balanced net inflow trend when the market rises. This phenomenon seems to indicate that investor confidence is growing and participant behavior is changing.
If we consider only smaller entities, such as small holders (
Cost Basis
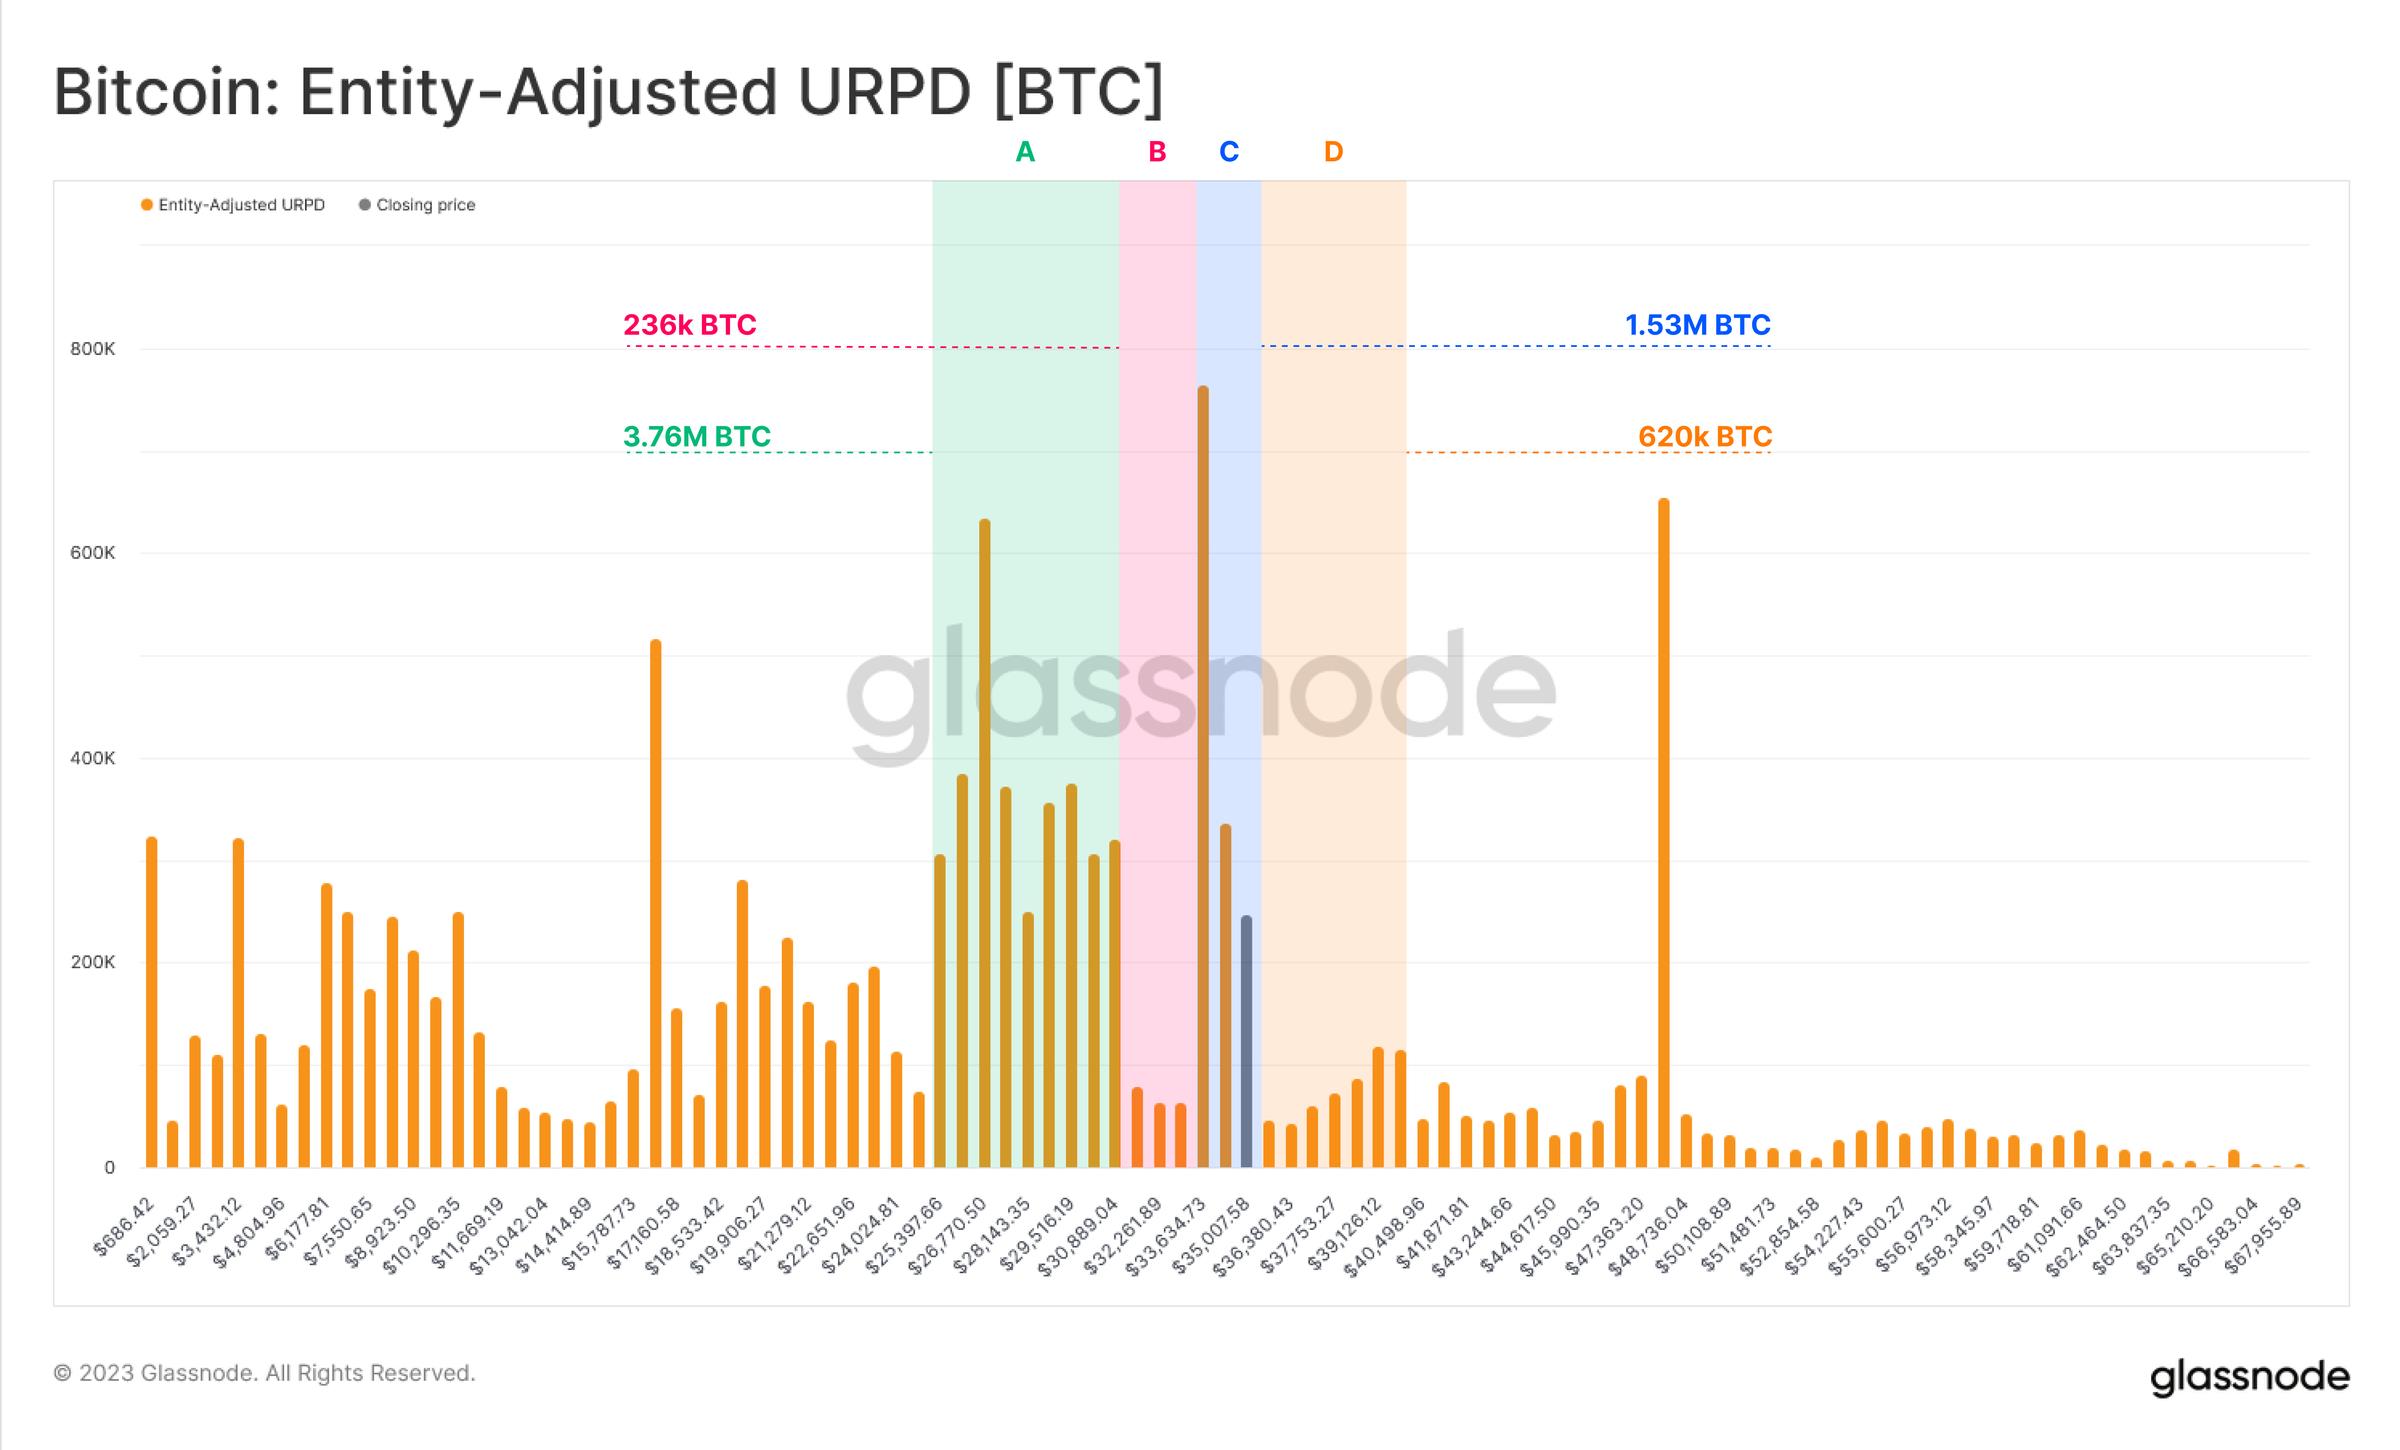
Finally, we can use the UTXO Realized Profit Distribution (URPD) to identify areas where the cost basis is densely concentrated, as well as price areas where relatively few coins are trading. We can see four areas of interest that are relatively close to our current spot price.
-
Part A: There is a large supply accumulation between $26,000 and $31,000 during the second and third quarters of 2023.
-
Part B: There was a “gap” between $31,000 and $33,000, and the price quickly crossed this area.
-
Part C: In the current price range, between $33,000 and $35,000, there is a fairly large amount of supply that has recently traded.
-
Part D: The cost basis for approximately 620,000 Bitcoins from the 2021-22 cycle is slightly above $35,000 to $40,000.
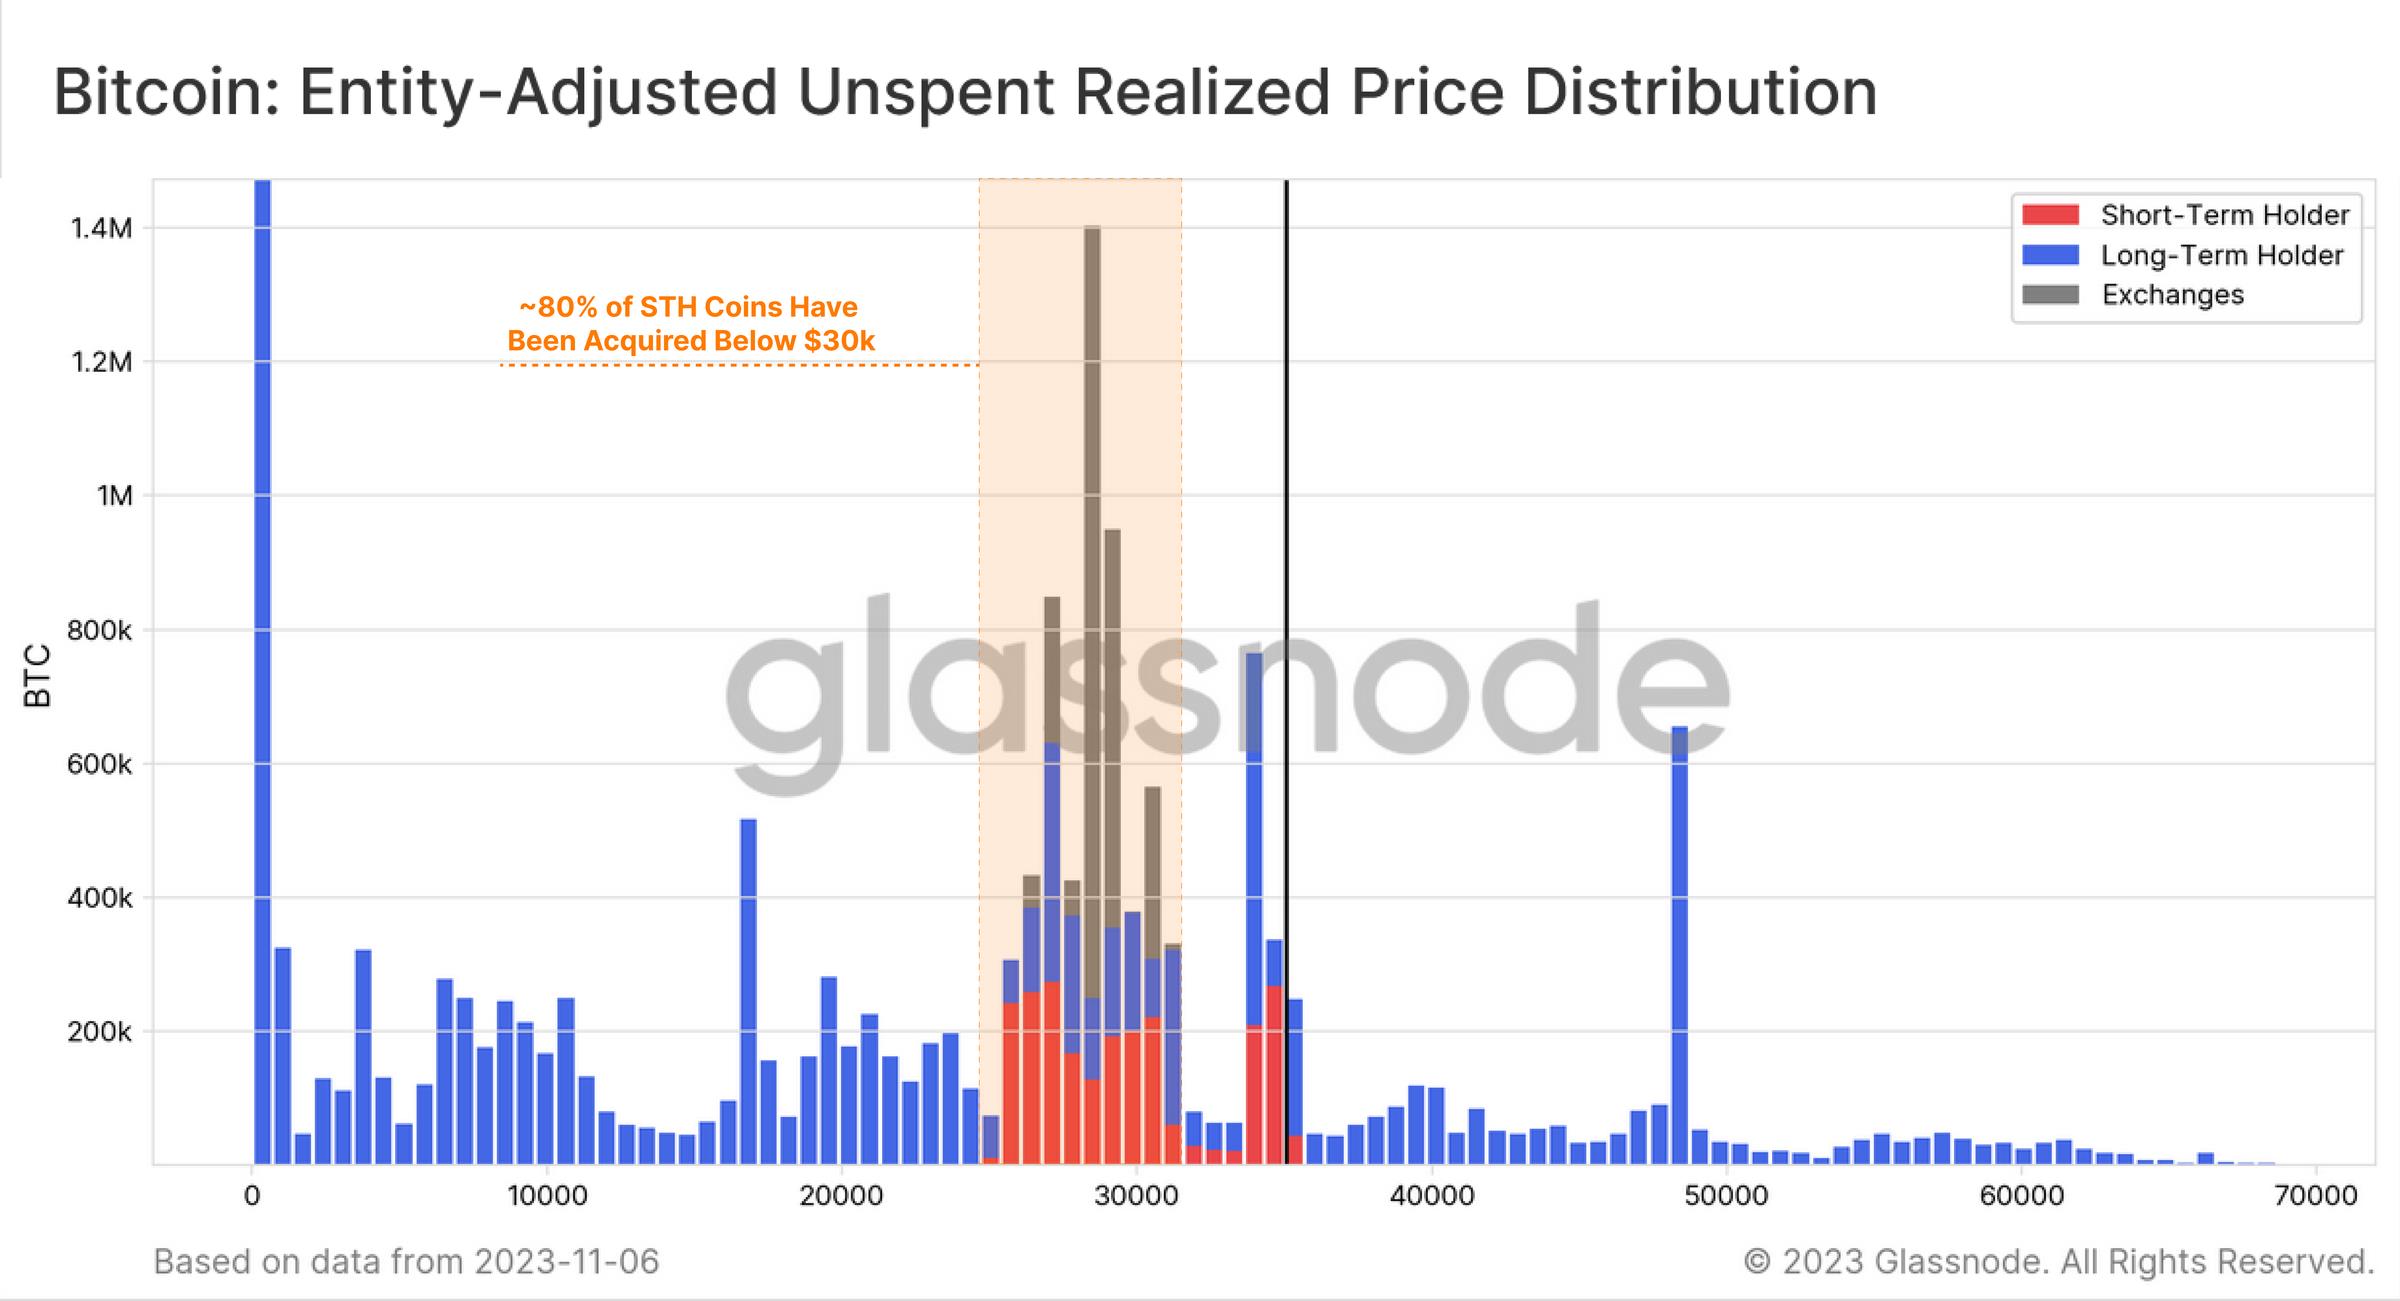
Finally, we can add color to the URPD distribution by breaking down holders into long-term and short-term categories. We notice that most short-term holders are now profitable, with most of them having a cost basis between $25,000 and $30,000. The rise in the STH seller risk ratio coincides with previous “profit taking” events that transferred coins to new investors within the current price range.
Overall, this suggests that the $30,000 to $31,000 price range is a key area to watch as this is the upper limit of the largest supply and cost basis cluster. Considering that there are almost no coins trading on the road from $35,000 to $30,000, this makes it interesting to see how the market reacts if and when prices return to $30,000. This also aligns with our WoC 44 This is consistent with the true market average price presented in , which is our best estimate of the "active investor cost basis."
Summary and Conclusion
比特币供应在历史上一直很紧张。当下,许多供应指标描述了“币不活跃”的状态达到多年甚至历史新高的情况。这表明尽管今年价格表现强劲,比特币仍被长期持有。随着 4 月份的减半预期以及美国现货交易所交易基金(ETF)的积极动力,未来几个月将对比特币投资者来说变得令人兴奋。
The article comes from the Internet:Data behind BTC's rise: supply is becoming increasingly tight, and long-term holders are clearly willing to hoard coins
Related recommendations: ETHS hits a new high, how sophisticated are the operations behind it?
The operation behind ETHS has proven how advanced the communication operation in the crypto asset circle can be. Written by: Jaleel, BlockBeats researcher While the ordinarys ecosystem was silent, Ethscriptions, which imitates BRC-20 Token, suddenly exploded, reaching 270…