Data Interpretation: The surge is finally over, what’s the next step?
Macro Analysis
Inflation is back, when will interest rates be cut?
The annual rate of core personal expenditure (PCE) in September was 3.7%, which was released on Friday, in line with market expectations. As the preferred inflation index of the Federal Reserve, core PCE revealed some important details:
-
The U.S. core PCE price index rose by 0.3% on a monthly basis, far exceeding the 0.1% in August and marking the largest increase in four months.
-
In September, personal consumption expenditures (PCE) increased by 0.7% month-on-month, exceeding the expected 0.5% and the previous value of 0.4%.
-
The month-on-month growth rate of personal income in September dropped from 0.4% to 0.3%, which was lower than expected. This was also lower than the CPI growth rate of 0.4% in September.
Key findings from the report include:
-
Inflation remains and is rebounding.
-
Although consumer spending is very hot, the income side is shrinking.
U.S. economic data continues to be impressive
The U.S. economy expanded more than expected in the third quarter to its fastest pace in nearly two years, the latest sign that the economy remains resilient in the face of high interest rates.
According to preliminary data, despite rising interest rates, inflationary pressures and various other domestic and global headwinds, driven by a strong consumer, the US economy's GDP growth in the third quarter still exceeded expectations, reaching 4.9%, far exceeding economists' forecast of 4.3%. This is an increase from 2.1% in the second quarter and the strongest figure since the fourth quarter of 2021.
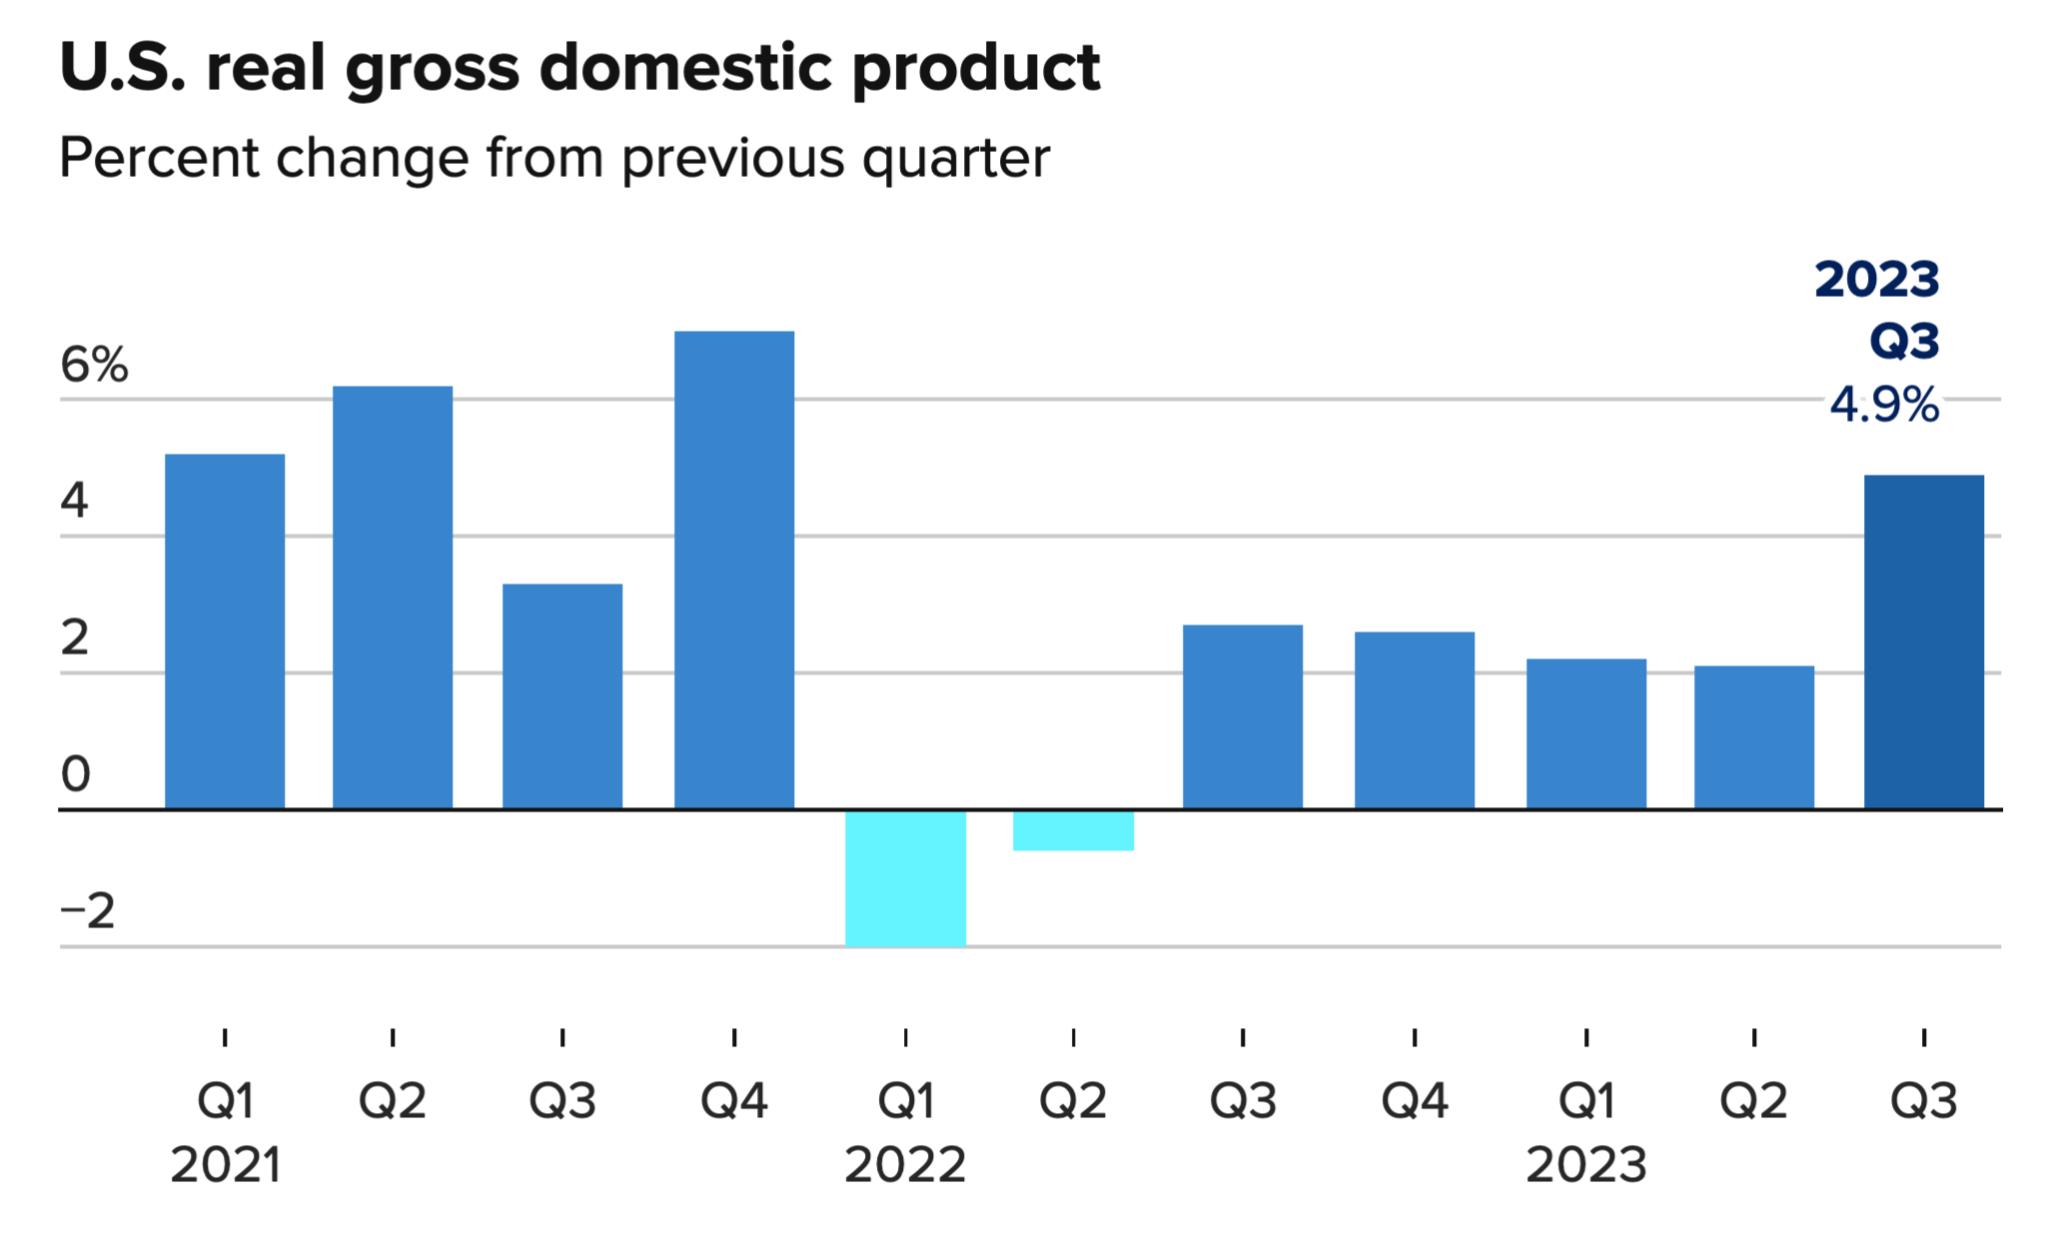
U.S. GDP growth in the third quarter exceeded expectations
GDP growth came even as the Fed raised interest rates at the fastest pace since the early 1980s and said it would keep them high until inflation returns to acceptable levels. Although inflation has fallen in recent months, price increases have been well above the central bank's 2% annual target.
We believe that neither PCE nor GDP will change the outlook for monetary policy, but the real problem behind the two data is that, against the backdrop of stagnant or even shrinking incomes, consumption trends may not continue in the coming quarters, and high interest rates will have a substantial impact on the U.S. economy. We will continue to pay attention to this.
Fundamental analysis
The price of currency has skyrocketed, what will the future hold?
1. exchangeBitcoin Stock
cryptocurrency交易所比特币的存量与市场上用户持有加密货币的意愿有关。当交易所存量快速上升,代表比特币持有者将加密货币存入交易所wallet,以便于卖出变现;反之,当交易所存量下降,代表整体将加密货币资产转移至交易所外的钱包,表明长期持有的意愿增加,对币价有提振作用。
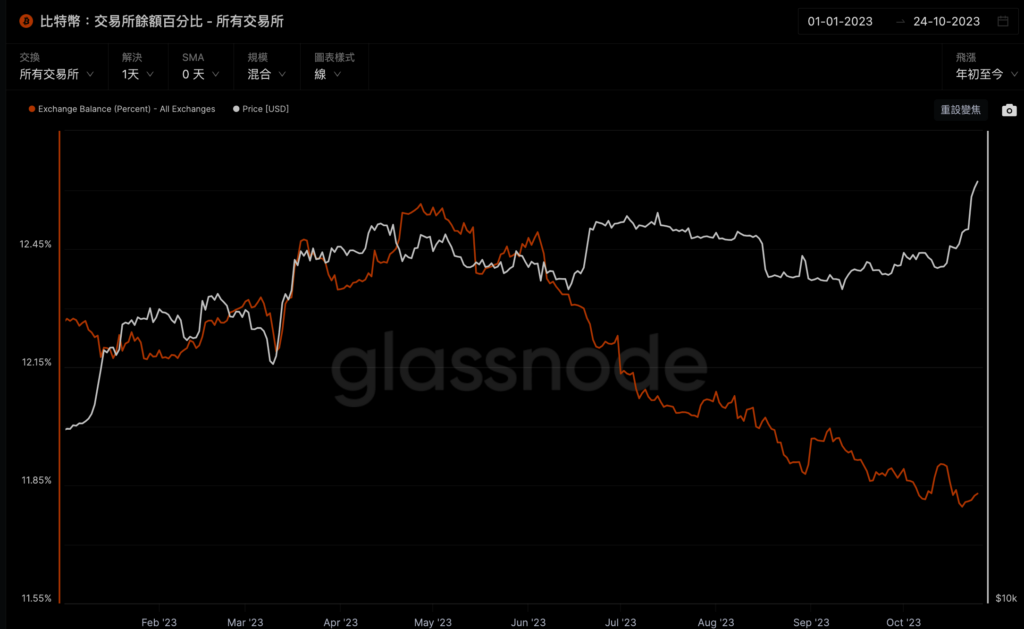
According to glassnode data, since May, the balance of bitcoin on exchanges has shown a unilateral downward trend, indicating that the willingness to hold bitcoin for a long time has increased, the proportion of bitcoin that can be sold has decreased, and the corresponding market selling pressure has shown a decreasing trend. This shows that investors believe that the price of bitcoin will rise in the future and gradually begin to accumulate spot positions in their hands, which is a positive bullish signal. However, the data has still risen slightly recently, indicating that a certain potential selling pressure has accumulated in the short term.
At the same time, due to the reduction in market supply, only a small increase in demand is needed to pull up the market and push prices up quickly. In this context, we still believe that futures leverage trading still needs to be done with caution, especially high-multiple short selling.
2. Exchange stablecoin inventory
When the stock of stablecoins on exchanges increases, it means that many investors are still waiting and have not really entered the cryptocurrency market. This means that investors are bearish on the market and are holding their stablecoins.TokenSell and exchange for stablecoins; when the stock of stablecoins decreases, it means that more investors sell stablecoins and exchange them for tokens such as Bitcoin and Ethereum, which is a bullish signal for the market.
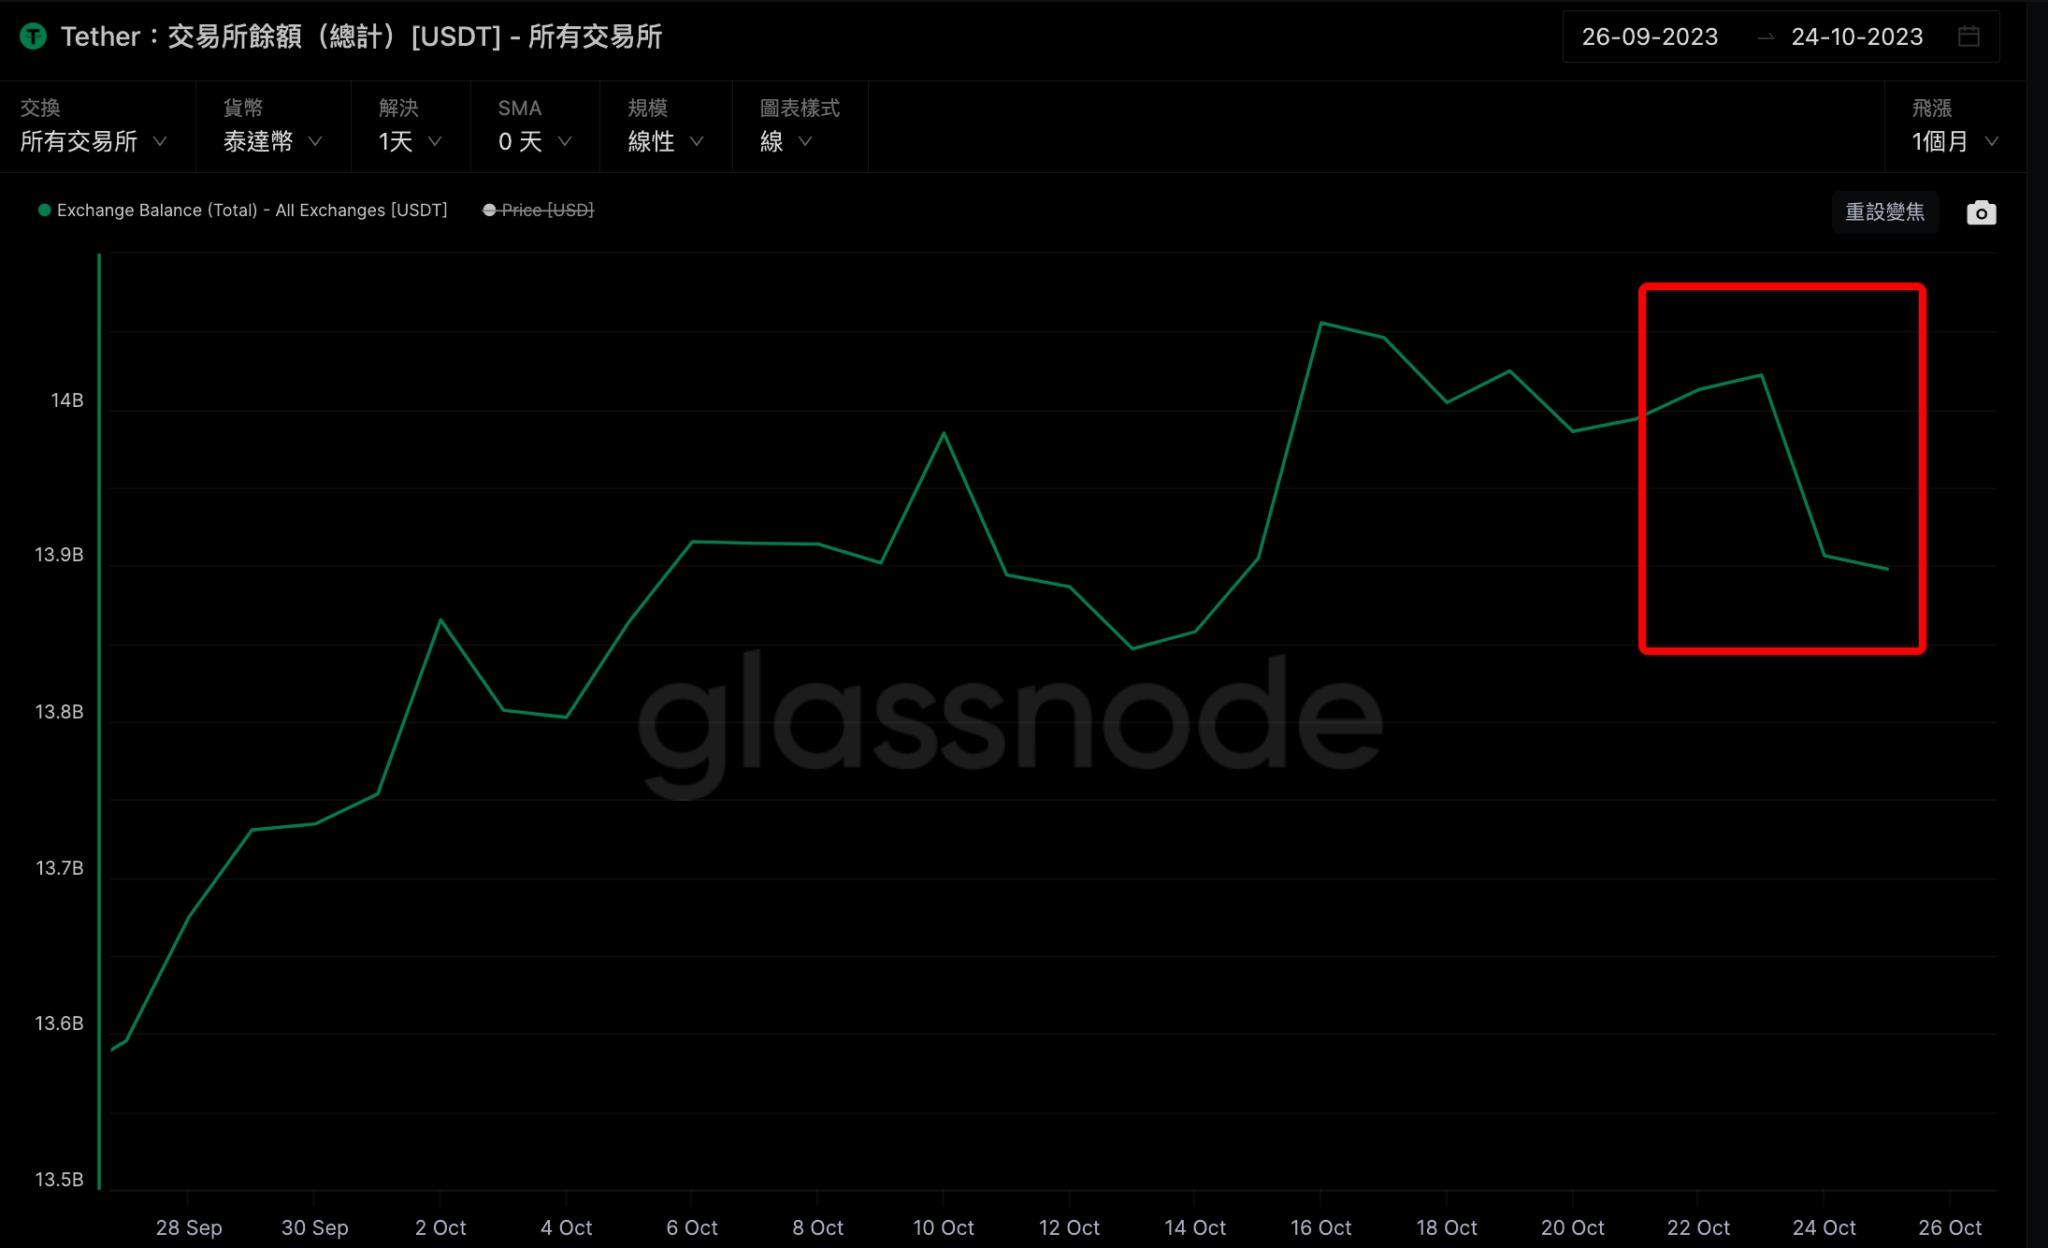
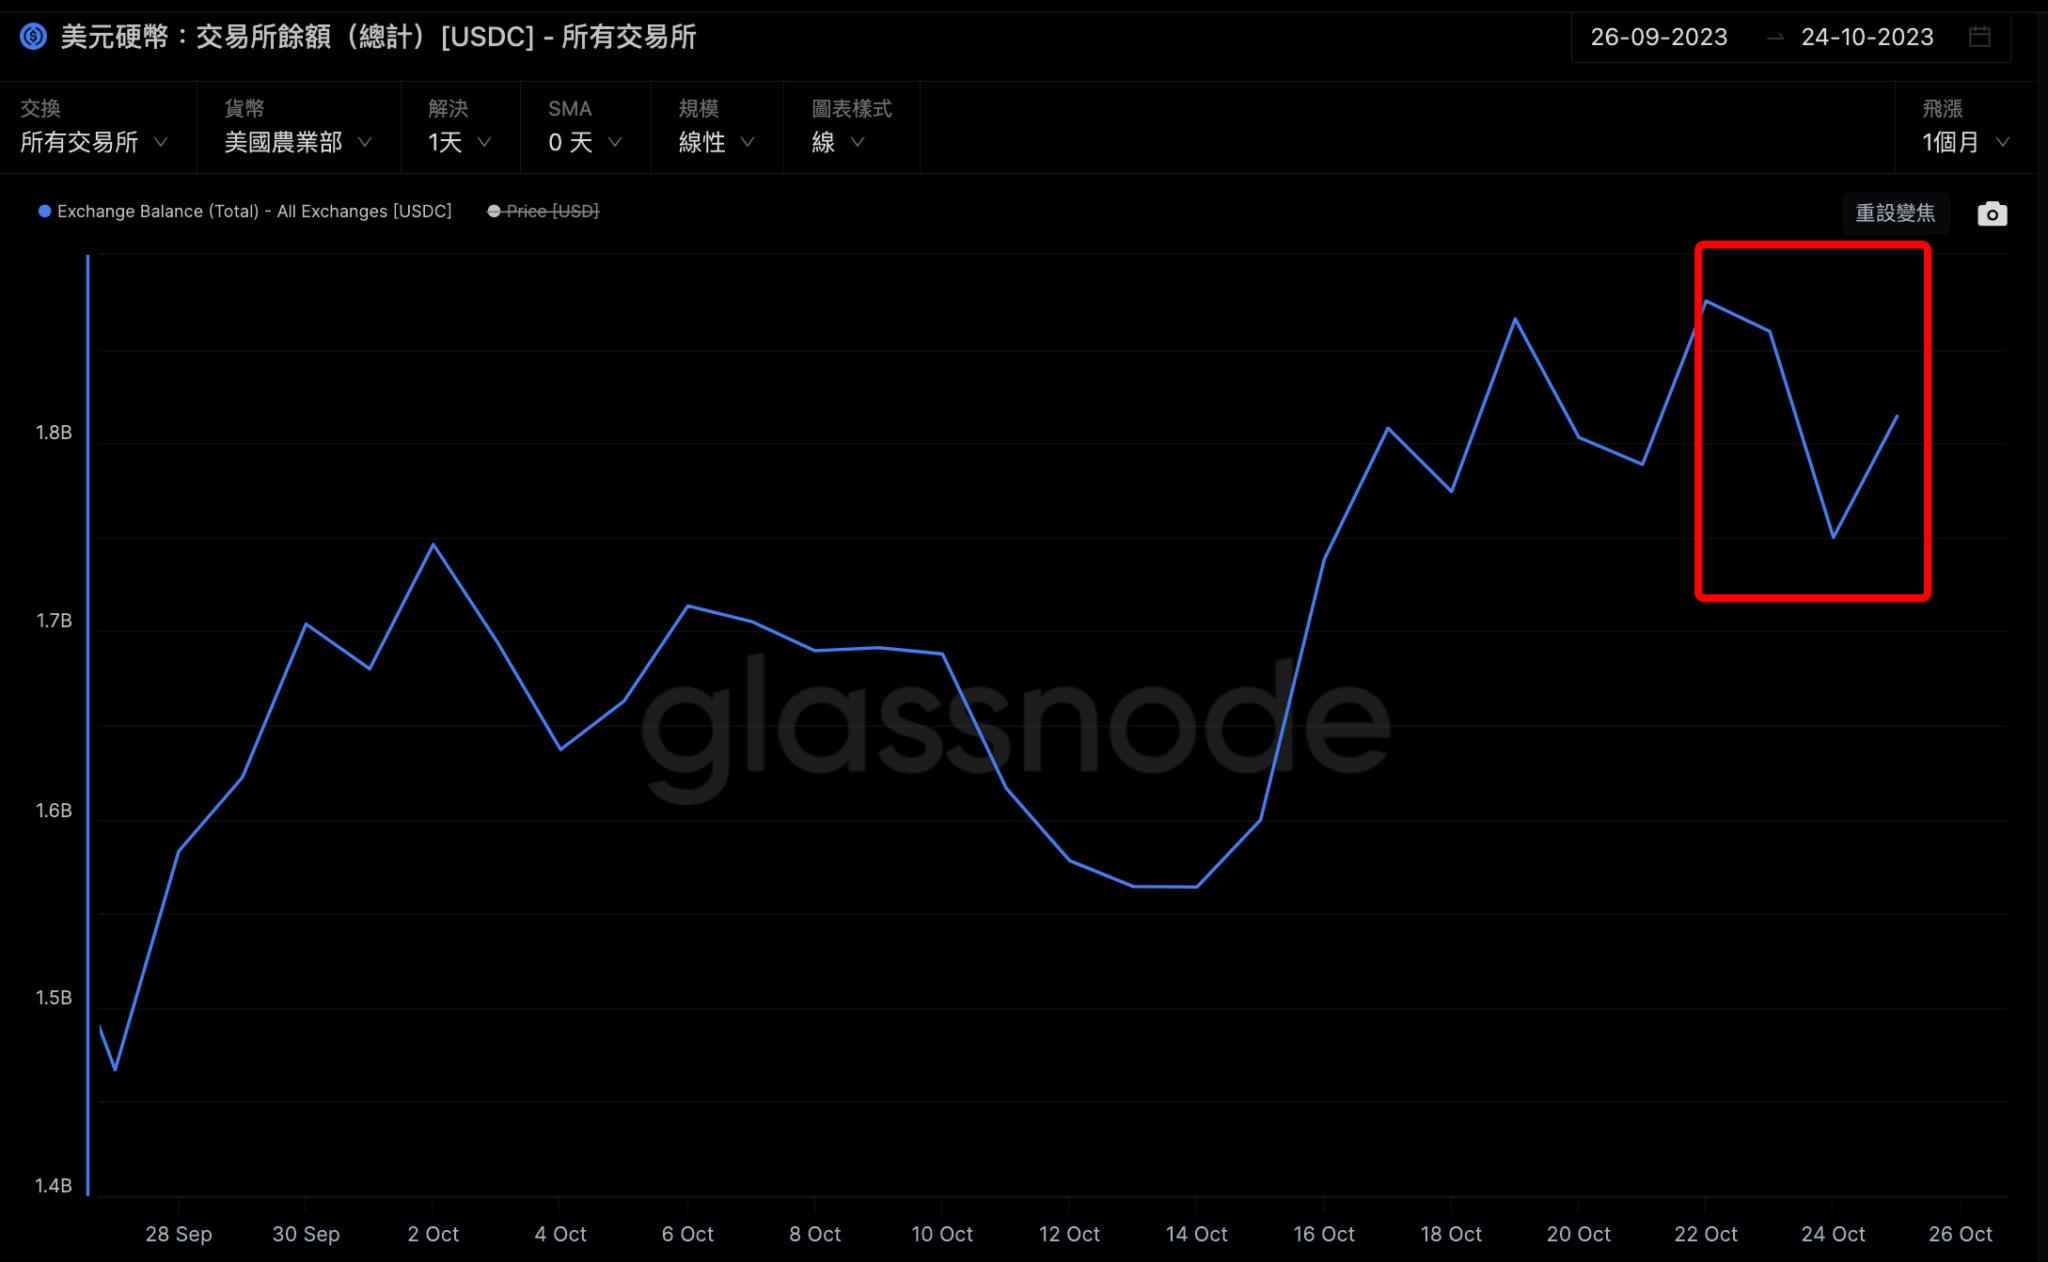
The total market value of stablecoins is about $122 billion, of which USDT and USDC account for nearly 87%. From the latest data on the stablecoin inventory of exchanges, the exchange inventory of USDT and USDC has shown a significant downward trend in recent times, indicating that the market has a clear bullish sentiment.
Exchange data shows that the current market sentiment is still high. In the context of the total market value of stablecoins remaining stable, more people are choosingXiaobai NavigationBuying and holding Bitcoin has led to a marginal decrease in the stock of stablecoins and a marginal increase in the stock of Bitcoin. Whether this situation can continue still needs time to verify. We will continue to update the data in the future to bring you the latest interpretation.
Technical Analysis
Bitcoin
Last week, we wrote about Bitcoin’s return to bullish territory. On Monday, Bitcoin broke through all resistance levels, officially putting us back in bullish territory. The magnitude of this breakout speaks to the large amount of capital waiting to enter the market, as well as the fear of missing out (FOMO) among investors. Some say this price move may have been influenced by the news that Blackrock’s Bitcoin ETF ticker IBTC was added to the DTCC website, marking another step in the ETF’s SEC approval process. However, there are reports that IBTC was actually added to the DTCC in August of this year, but the coin’s price did not start to trend on Twitter until after the rally.
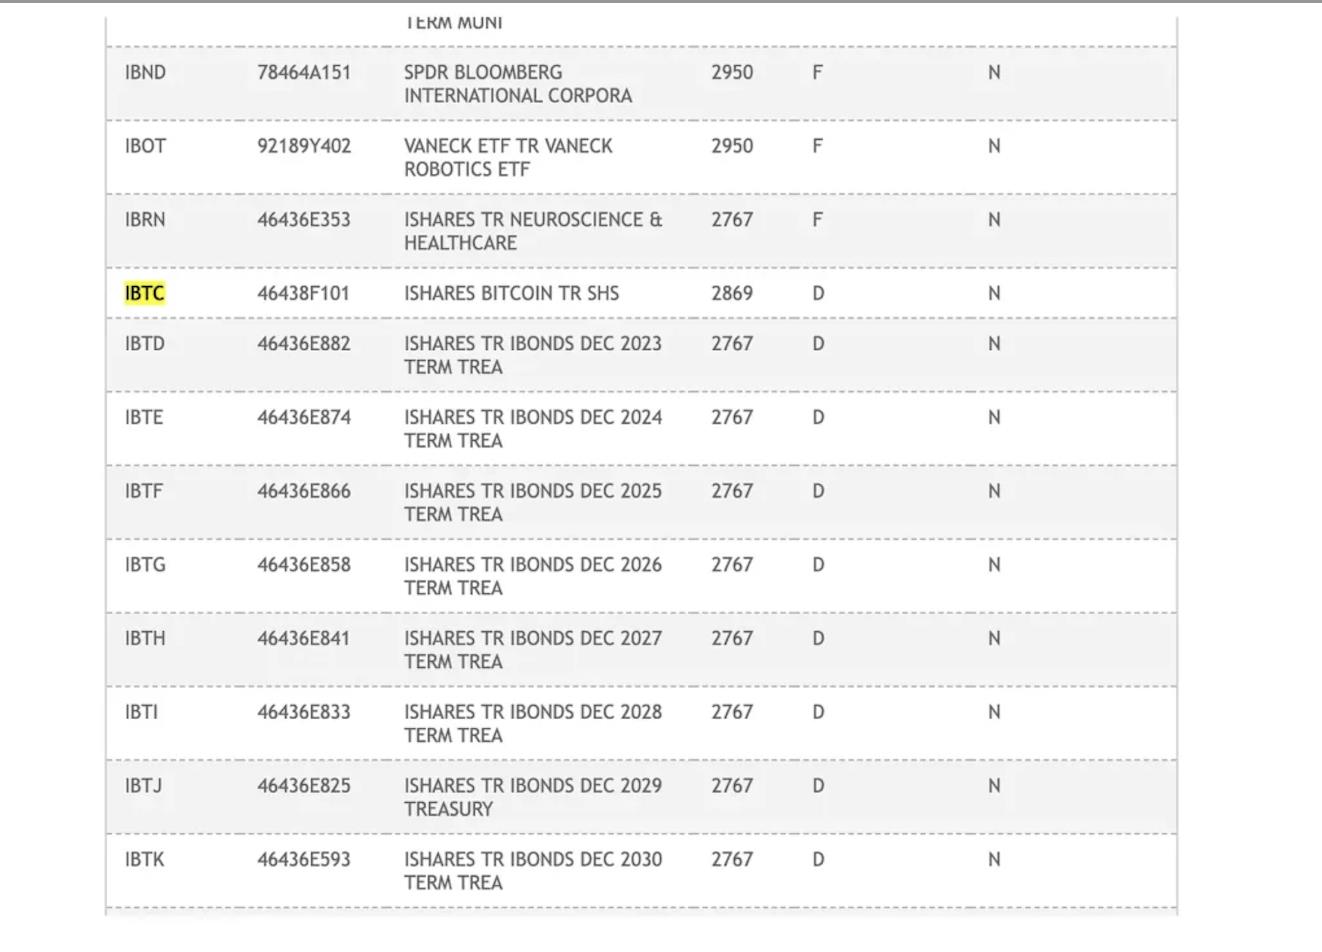
Blackrock issued a statement saying that a ticker listed on the DTCC does not guarantee ETF approval. Like Blackrock's other ETF applications, this is just a basic preparation. However, after the clarification, the re-inflow of marginal funds did not stop, which further supports our view that this rally was caused by FOMO traders.
The weekly close has just taken place and the spread of the candlesticks (low → high) is increasing on increasing volume. This is a clear bullish signal. In addition, both the 50-day and 200-day moving averages are at an upward angle, indicating an overall uptrend. While the RSI has just reached overbought conditions, in the long-term frame it may actually represent a strong trend brewing (e.g. October 2020).
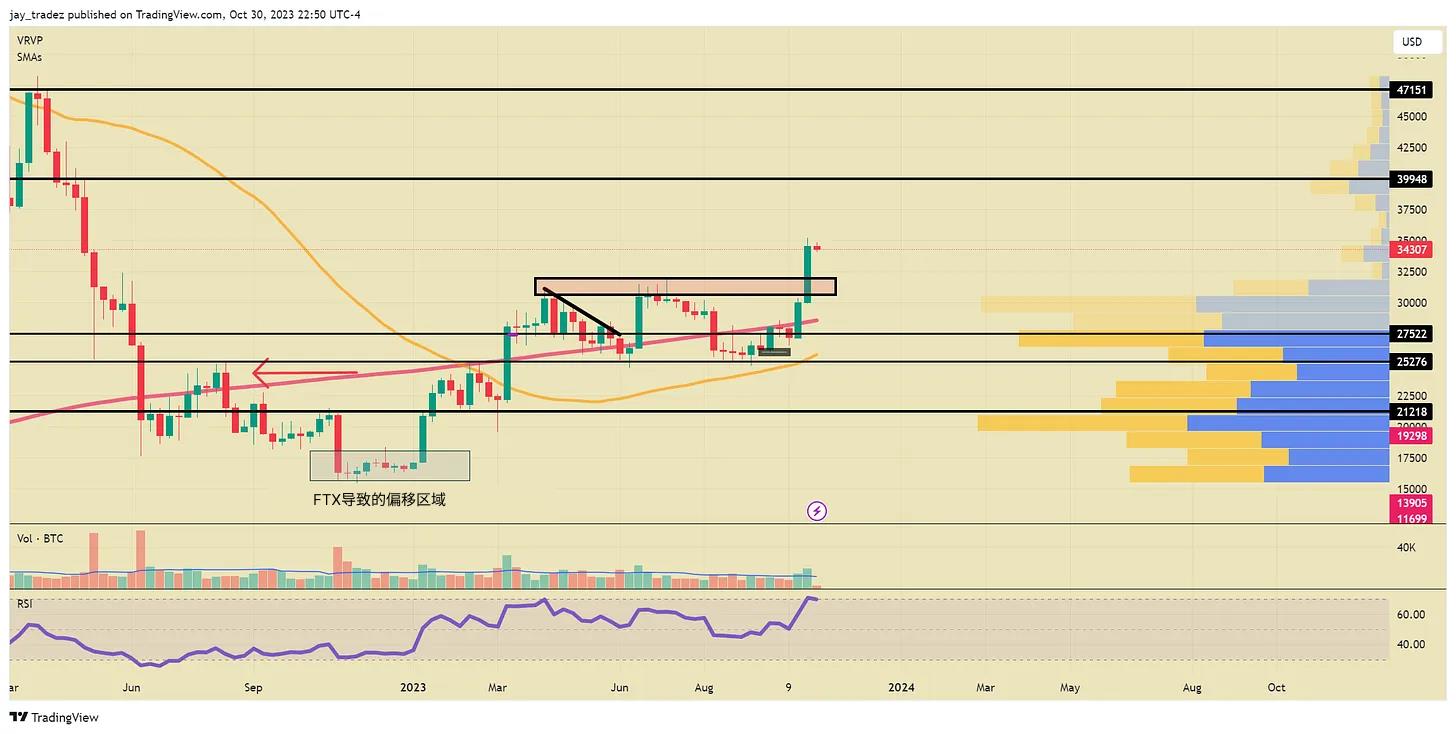
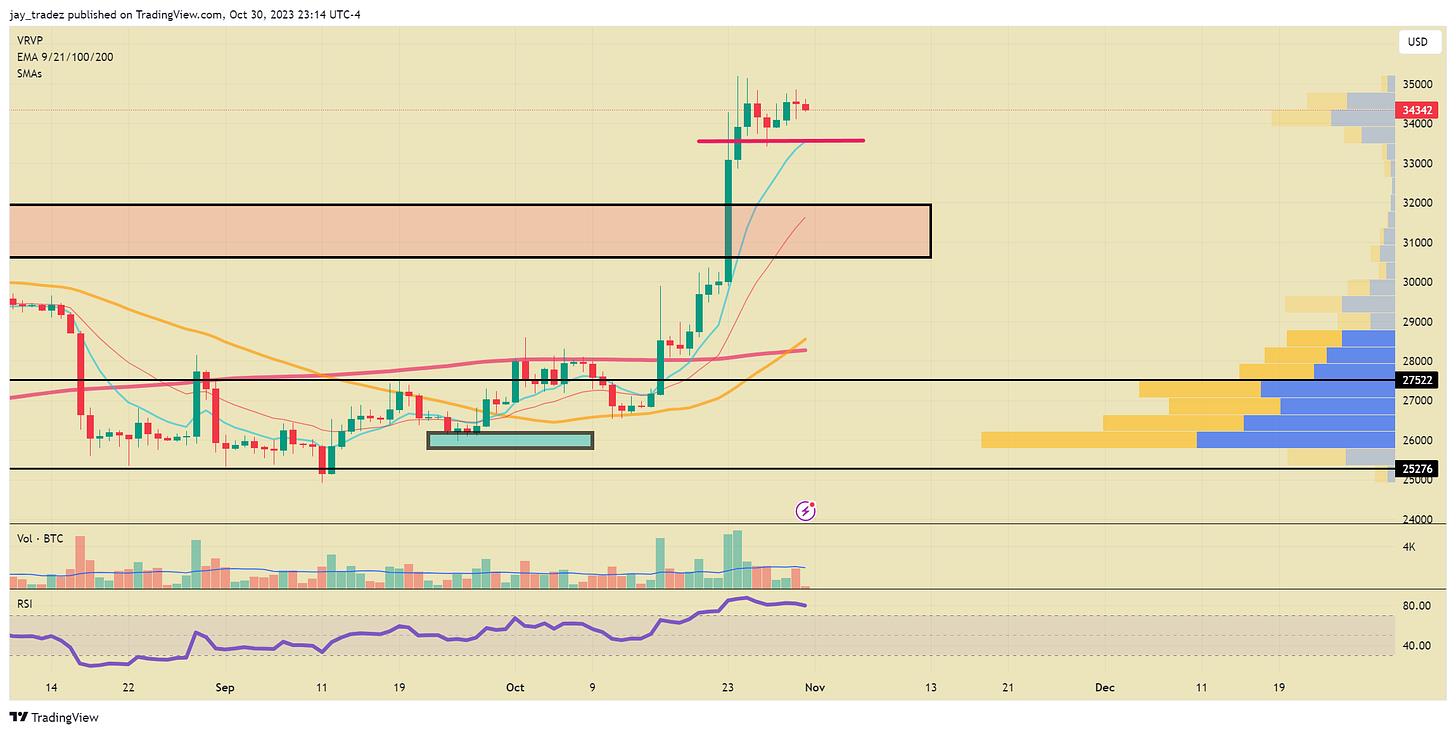
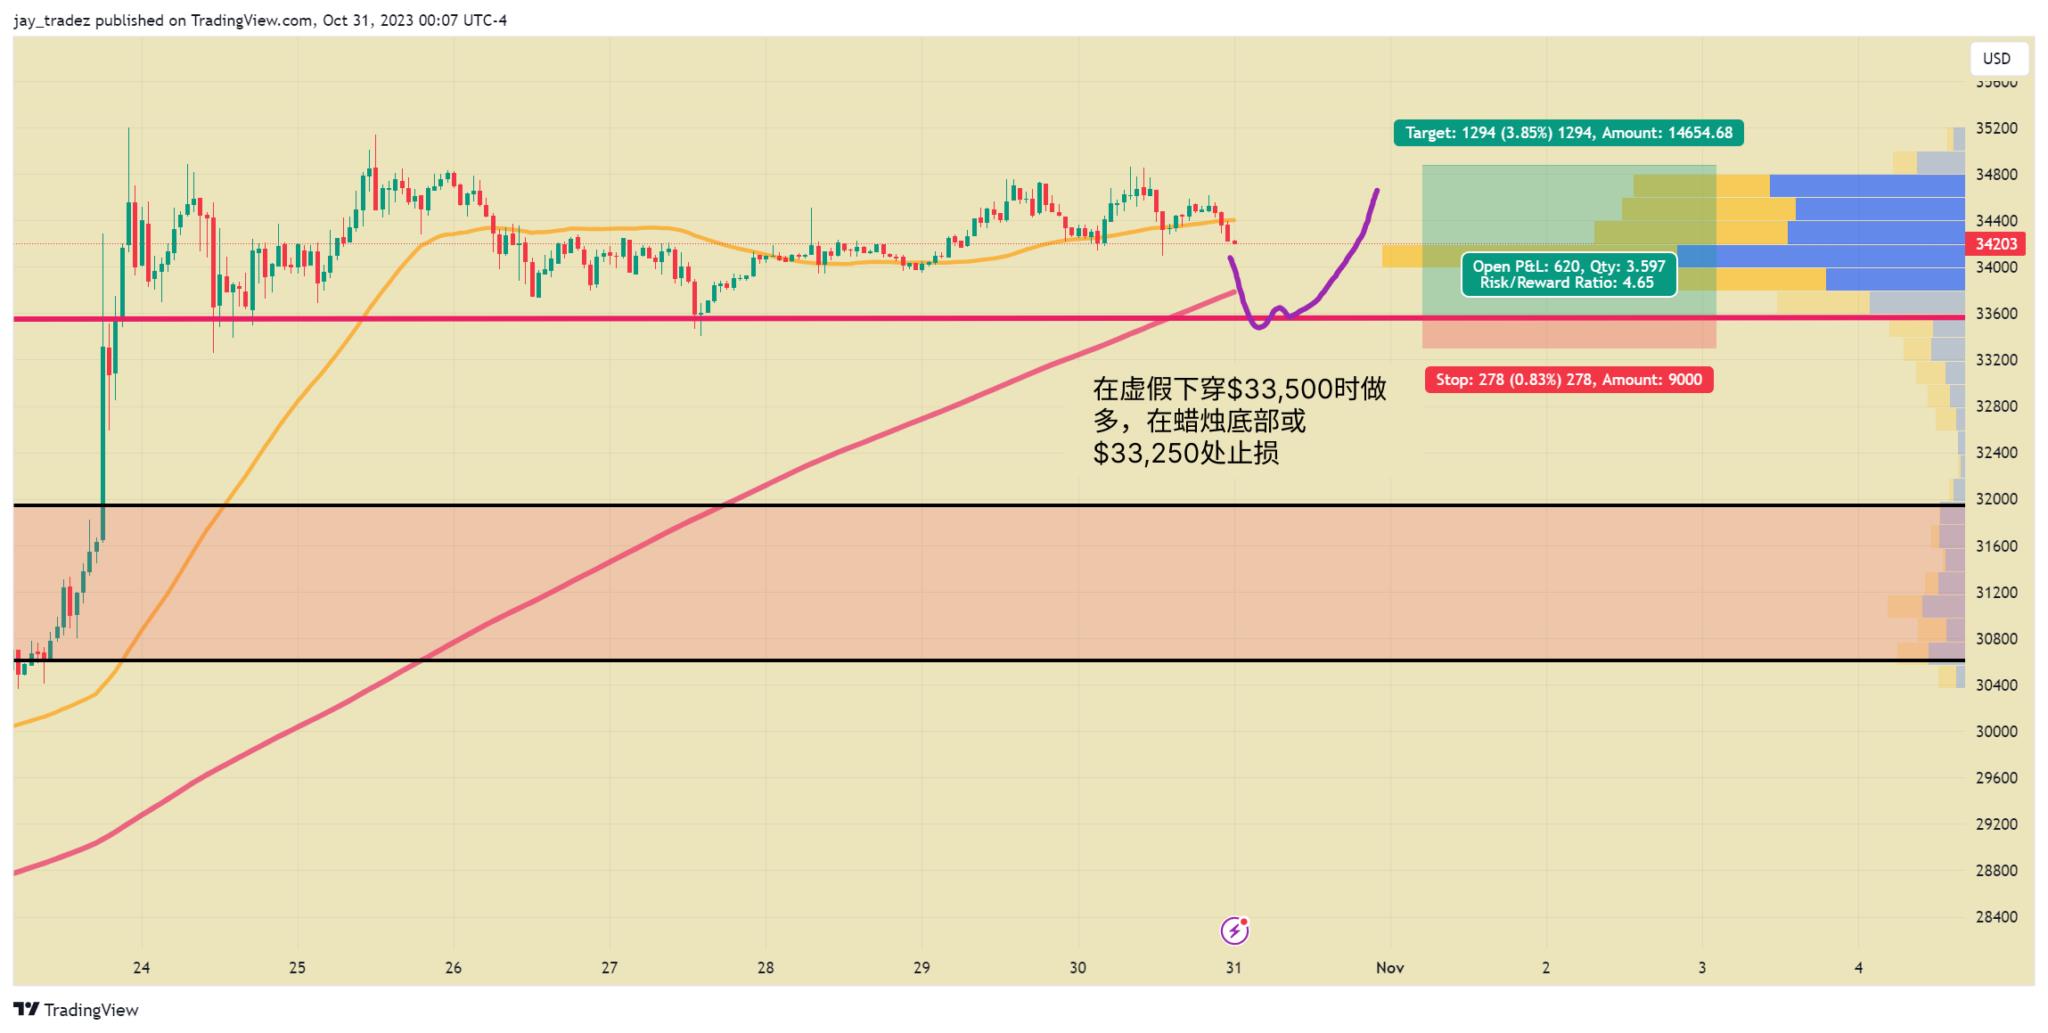
We are currently bullish and believe that the probability of Bitcoin falling below $30,000 is low. From the daily K-line data, it looks like a bullish consolidation state. What we hope to see is that BTC breaks through $33,500 and forms support. In this scenario, going long will bring a good risk-reward ratio. Another option is to wait for a daily breakout and close above $35,000. If such a market occurs, we will be able to test the next resistance level at $40,000. However, like all breakthroughs, there is a possibility that it is a false breakthrough and may fall into a long-term dilemma.
In general, we don’t want to see price break below $32,000 as that is the long term resistance area and the previous high from 2023 that we just broke. Price below $32,000 will destroy the price structure. However, if we want to give it some wiggle room, $30,000 might be the last support level to watch as that is the short term resistance level we broke through. Although we think this is very unlikely, if price breaks below $30,000 at some point, we will retest $25,000 and possibly break below. All the FOMO buyers will lose money and the whole narrative will be broken.
SPX/NDX
It’s hard not to notice the growing unease in the markets right now. Last Friday, the S&P 500 officially entered correction territory as it fell more than 101% from its 2023 peak. The Nasdaq fared even worse, falling more than 121% and the Dow Jones had its most challenging week since the March banking crisis.
The most recent University of Michigan survey showed a notable decline in both consumer sentiment and consumer expectations, which is concerning considering that consumer spending is the primary driver of real GDP growth.
The chart below shows the relationship between Nasdaq price changes and the percentage of Nasdaq-listed stocks above their 200-day simple moving average (SMA). It reveals a continued decline in positioning for small and mid-cap stocks starting in the first quarter of this year.
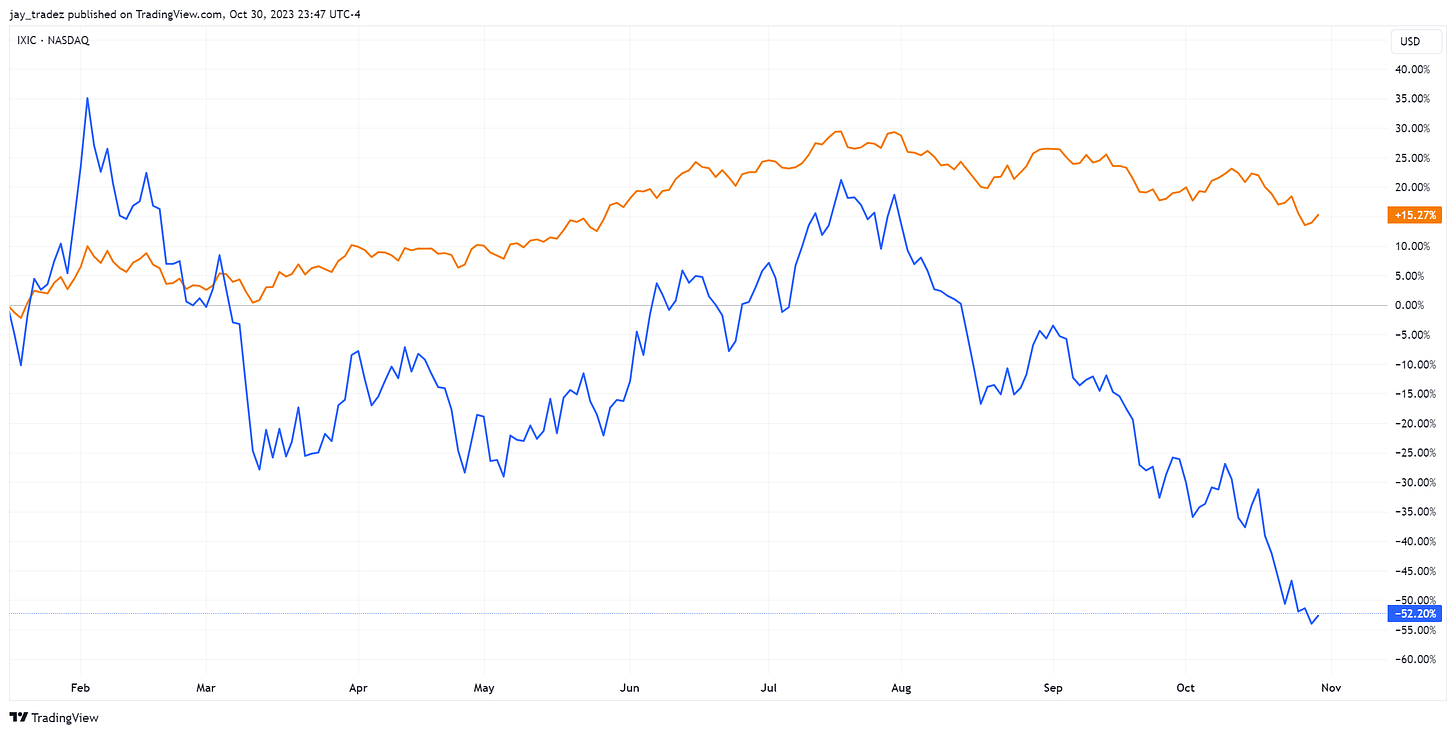
Blue Line:The percentage of Nasdaq below its 200-day moving average (200MA)Orange Line: Nasdaq Composite Index
Most of the capital in the index is concentrated in what we call the "Big Seven" (including Meta, Amazon, Google, Nvidia, Netflix, Microsoft, and Tesla). However, as companies like Google and Tesla released research reports that were not as good as expected, the entire index suffered. When we compare the Nasdaq100 with its equal-weighted counterpart, we observe that the equal-weighted index is not performing better than its regular version. This means that the decline of the Big Seven is negatively affecting the sentiment of the entire index.
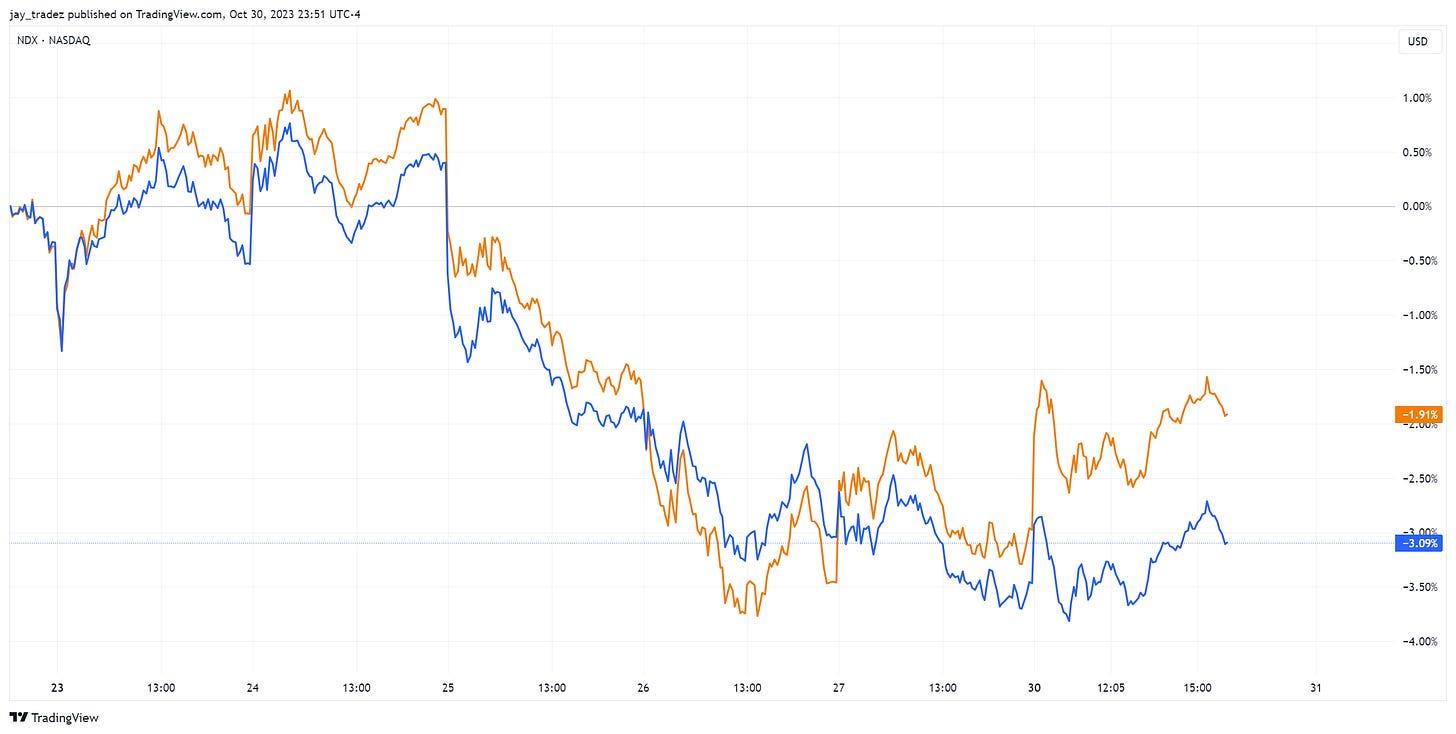
blue:Equal weight,orange color:NDX
Trading Advice
Bitcoin
Futures | Spot
In the technical analysis section, we introduced a short-term trading strategy that has a good risk-reward ratio and a high chance of profit. When the price breaks through $33,500 in the short term (5 minutes – 1 hour) and closes up, go long. Your risk at this point is $33,250 or the lowest point of the false break. The first target is $35,000, giving you a 4.5:1 risk-reward ratio. However, if you think the price will continue to rise, you can wait for the breakthrough of $35,000 before taking action.
The article comes from the Internet:Data Interpretation: The surge is finally over, what’s the next step?
Even if the Fed has to continue raising interest rates, Bitcoin will be able to survive. Compiled by GaryMa Wu said blockchain Note: This article is a translated version of the original text, and some content was deleted and summarized during the translation process. Due to space limitations or other reasons, some details or information may not be fully translated or deleted. We recommend that readers refer to the original text while reading this article for a more complete…