Analysis of on-chain stablecoin data in June: total market value increased, with issuance mainly concentrated in TRON and Ethereum
Written by Shawn, E2M Research
Overall data
In March 2024, we did some analysis on stablecoin data. Now a quarter has passed, and the entire stablecoin market has changed. According to DefiLlama data, the current total market value of stablecoins has reached 161.8 billion US dollars, compared with the total market value of 142 billion US dollars in March, the total market value of stablecoins has increased by about 20 billion US dollars. The main growth came from USDT (15.7 billion US dollars), USDC (3 billion US dollars), and USDe (2.9 billion US dollars). The decrease mainly came from TUSD (-800 million US dollars) and FDUSD (-700 million US dollars).
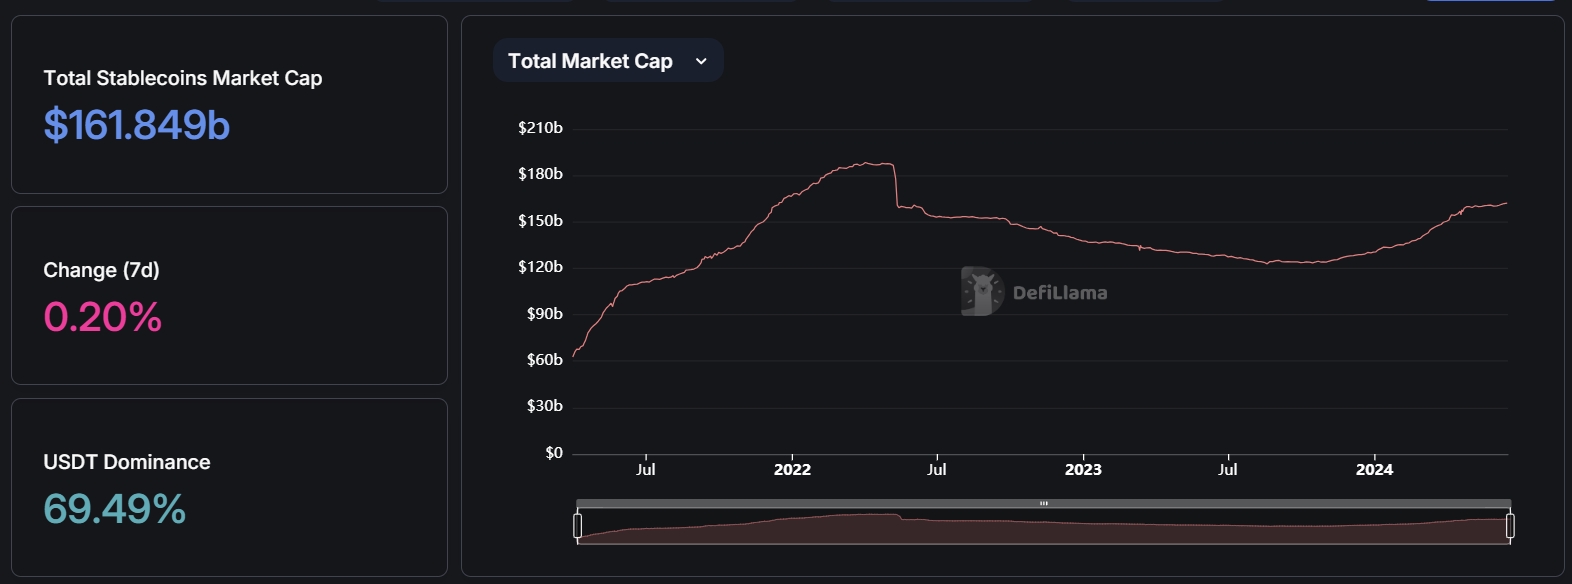
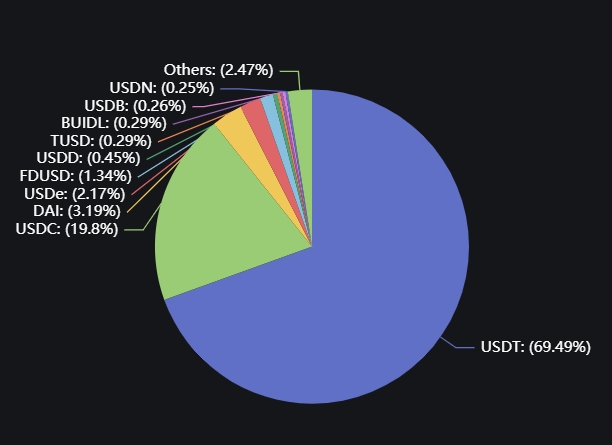
In terms of proportion, USDT and USDC still account for nearly 90% of the market share, with 69.49% for USDT and 19.8% for USDC respectively. This figure is close to the proportion in March.
After excluding USDT and USDC, we get the line chart of the remaining stablecoin data from January 1, 2024 to the present:
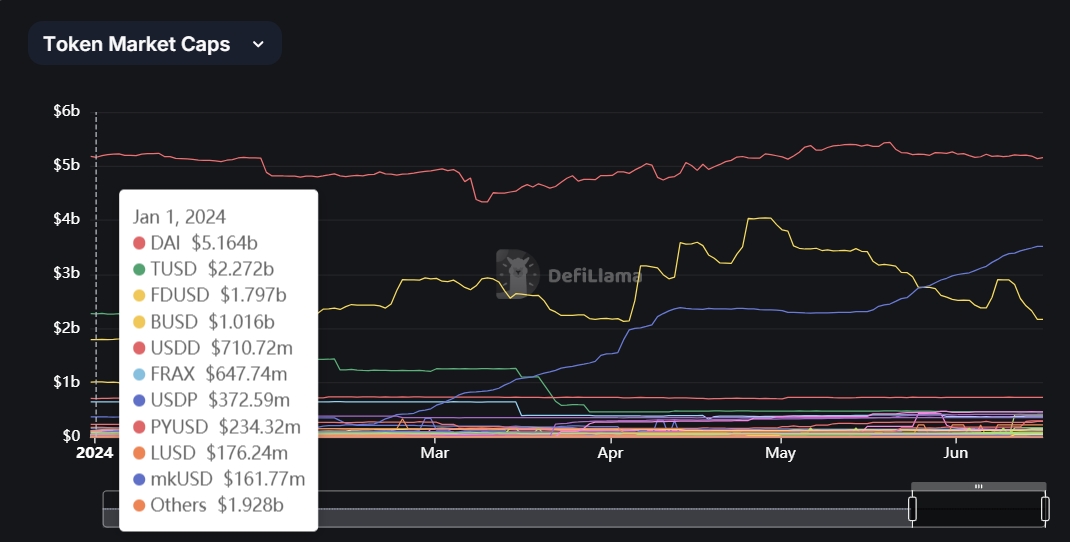
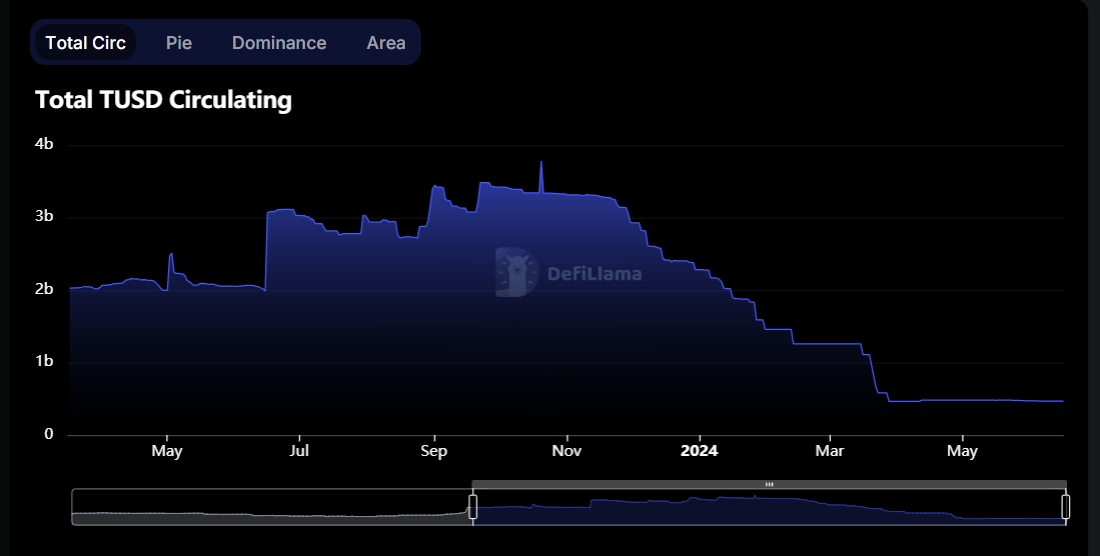
You can see DAI The market value of USDDe has not changed much, mainly because the market value of USDe has increased from $600 million in March to the current $3.5 billion, an increase of about 6 times. After reaching a high of $4 billion at the end of April, the market value of FDUSD has fallen back to the current $2.17 billion, a decrease of $1.83 billion. TUSD has decreased from $1.26 billion to the current $460 million.
USDT Data
The total market value of USDT continues to grow. After breaking through the historical high, it has been maintained at around 110 billion since early May, and has increased slightly recently.
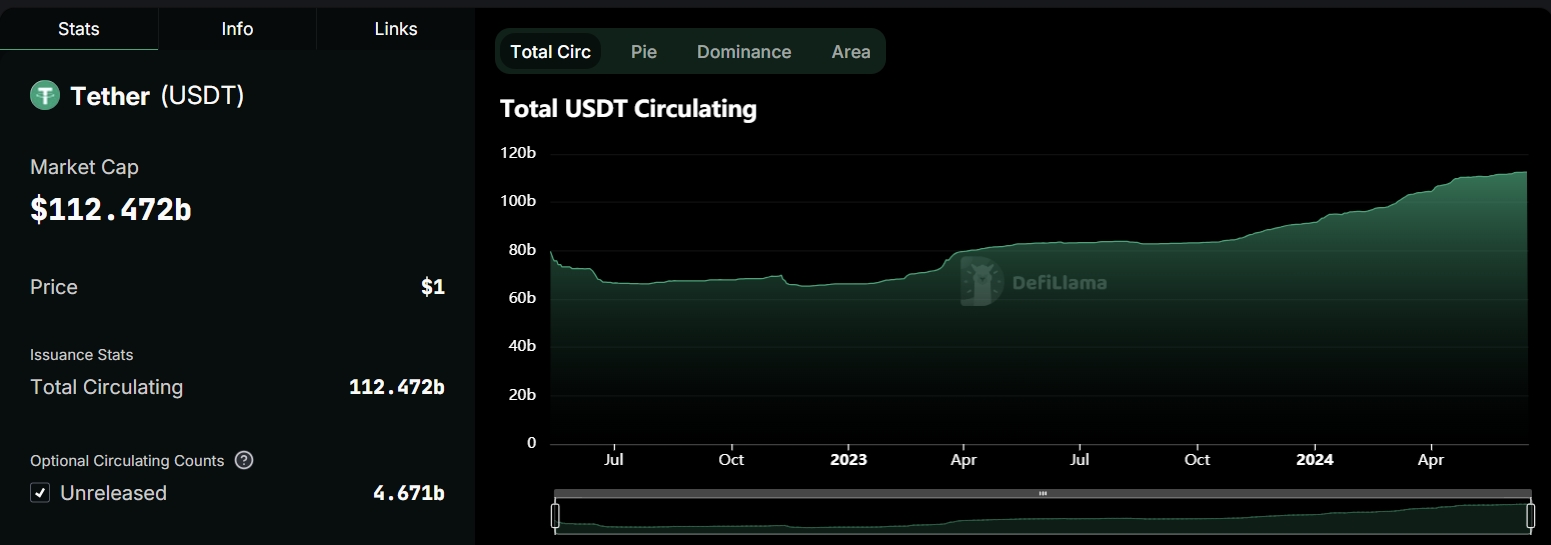
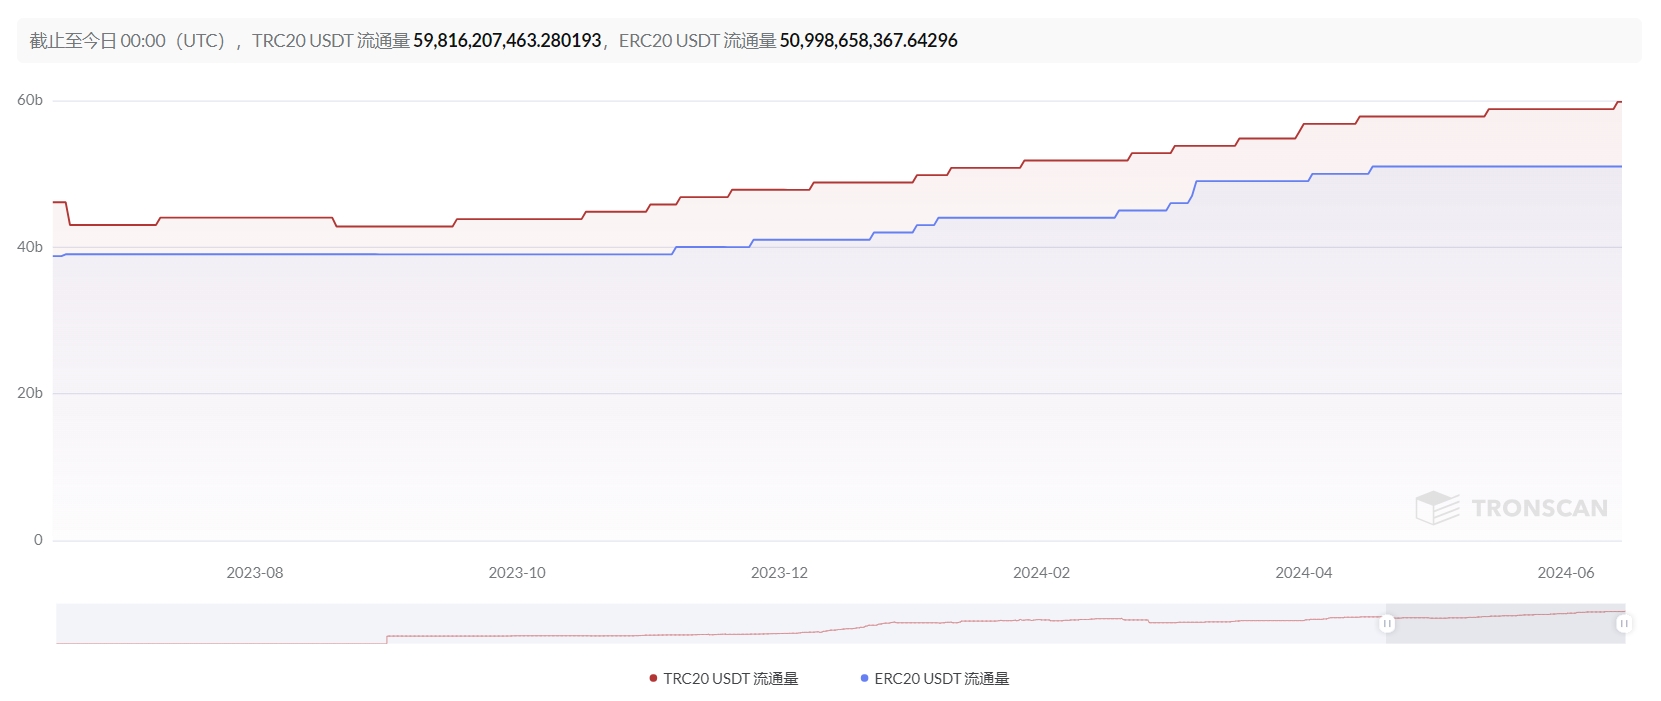
The main issuance is still concentrated on TRON and Ethereum, with TRON at $59.8 billion and Ethereum at $51 billion. As shown in the figure below, the USDT on Ethereum has not changed since it reached 51 billion at the end of April, while the USDT on TRON is still being issued.
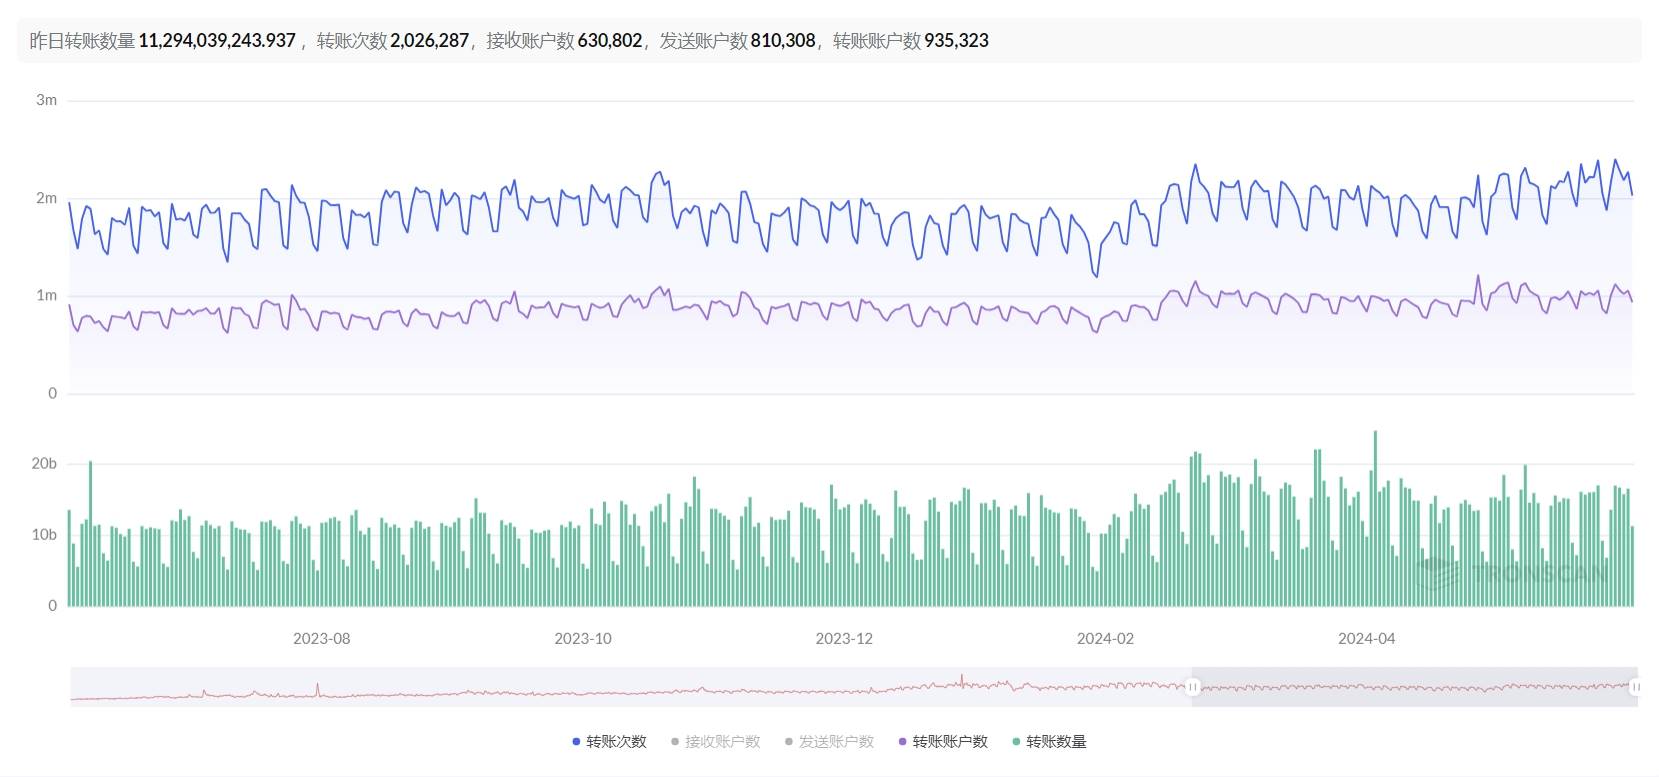
There have been no significant changes in the number of transfers, the number of transfer accounts and the amount of transfers.
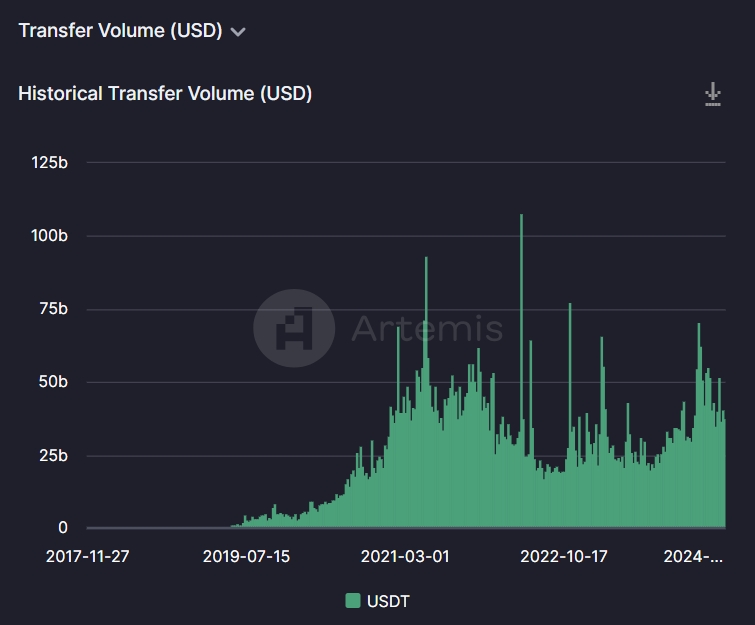
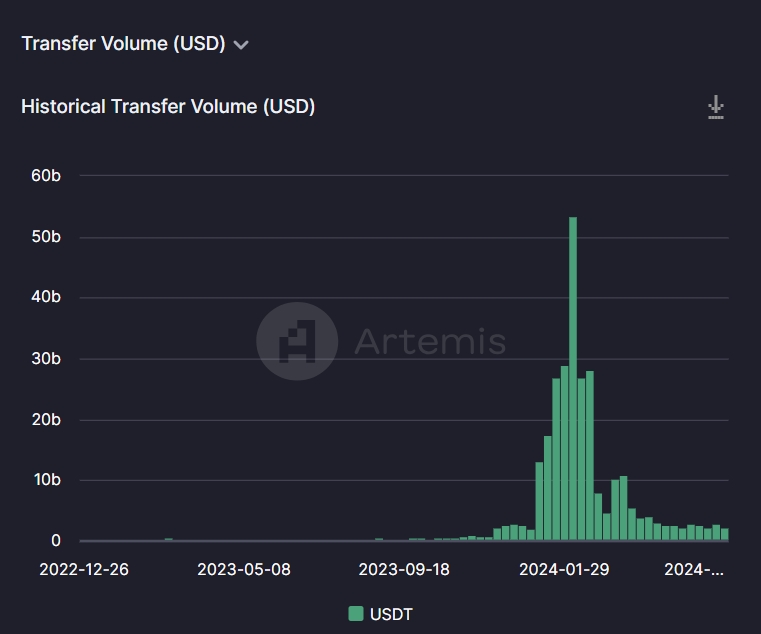
According to USDT data on Ethereum, the transfer volume has dropped slightly from 50 billion per week in March to 40 billion per week today.
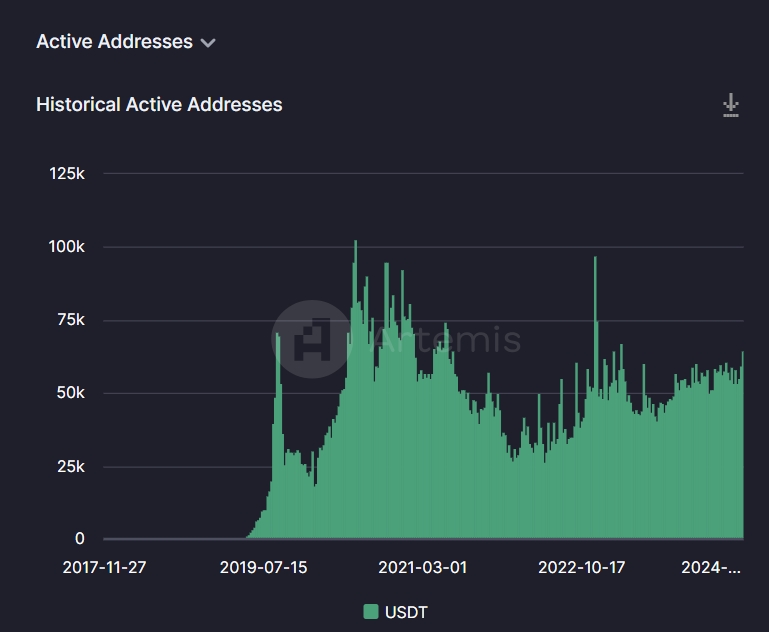
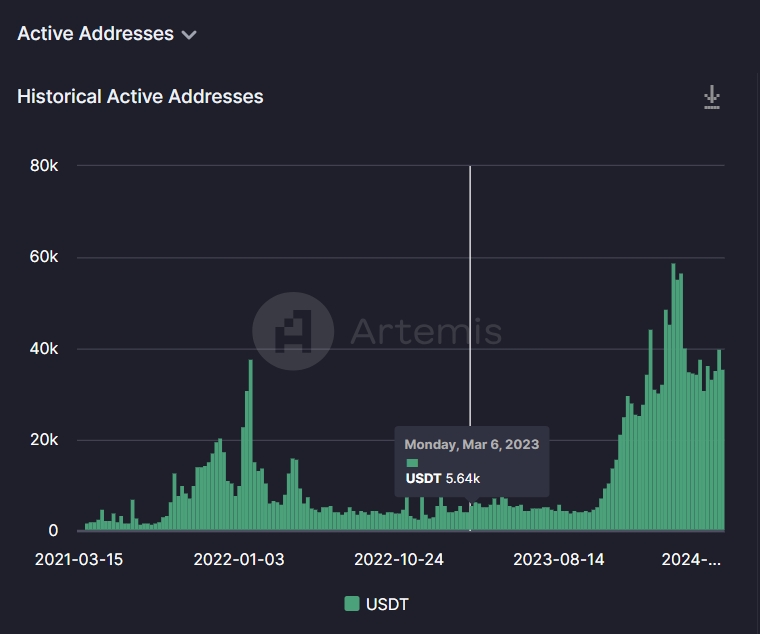
In terms of the number of active addresses, it increased from more than 50,000 weekly active addresses to more than 60,000 weekly active addresses.
As for USDT on Solana, its transfer volume and number of active addresses have continued to decline after reaching a high point at the beginning of the year:

An important change is that USDT began to be issued on Ton on April 19, and grew to US$580 million in two months.
According to gasfeenow.com data, compared with mainstreamBlockchain Gas fee required for USDT transfer transaction:
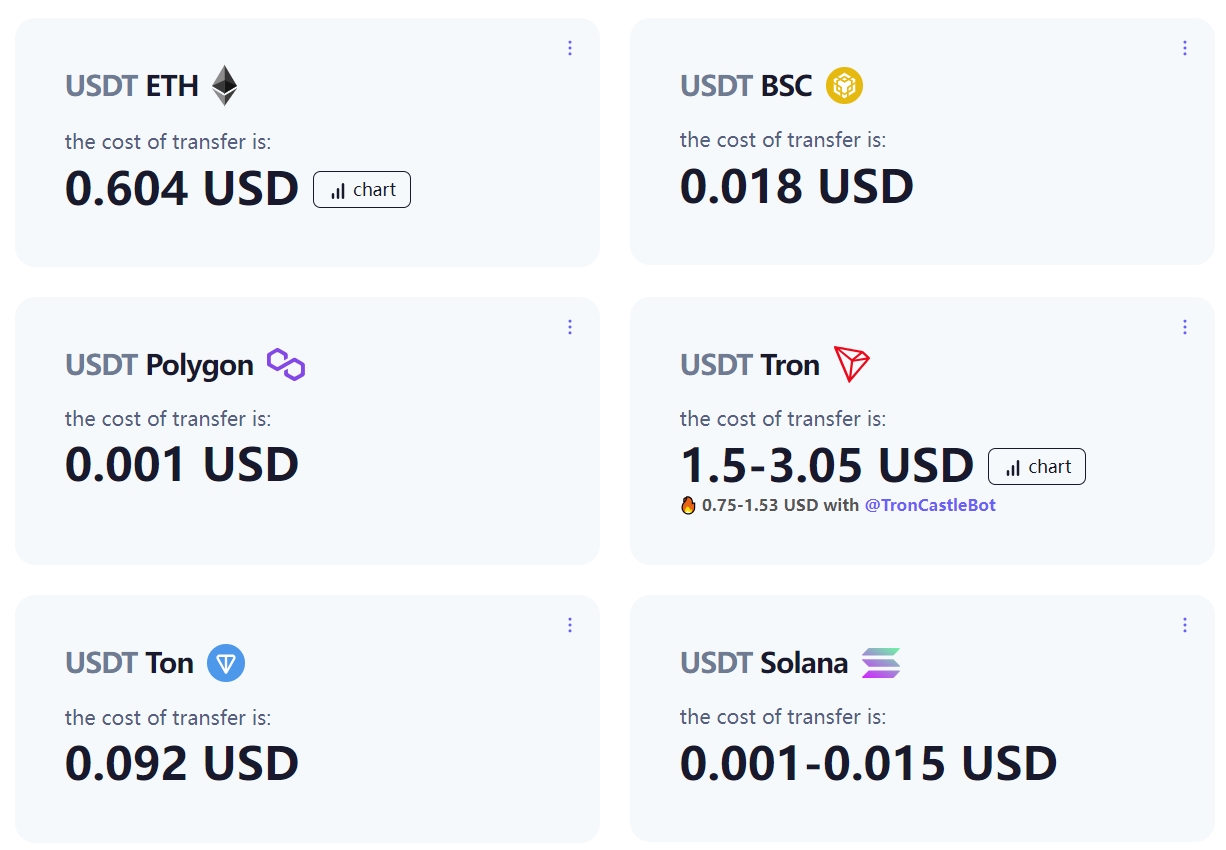
It can be seen that the gas fee consumed for USDT transfers on Tron is currently the highest, even more than three times that of Ethereum. In comparison, the transfer costs on Polygon and Solana are the lowest, while the consumption on Ton is at a medium level. However, with the help of the huge number of users on Telegram, whether the USDT application on Ton will seize the market share of Tron remains to be observed.
USDC Data
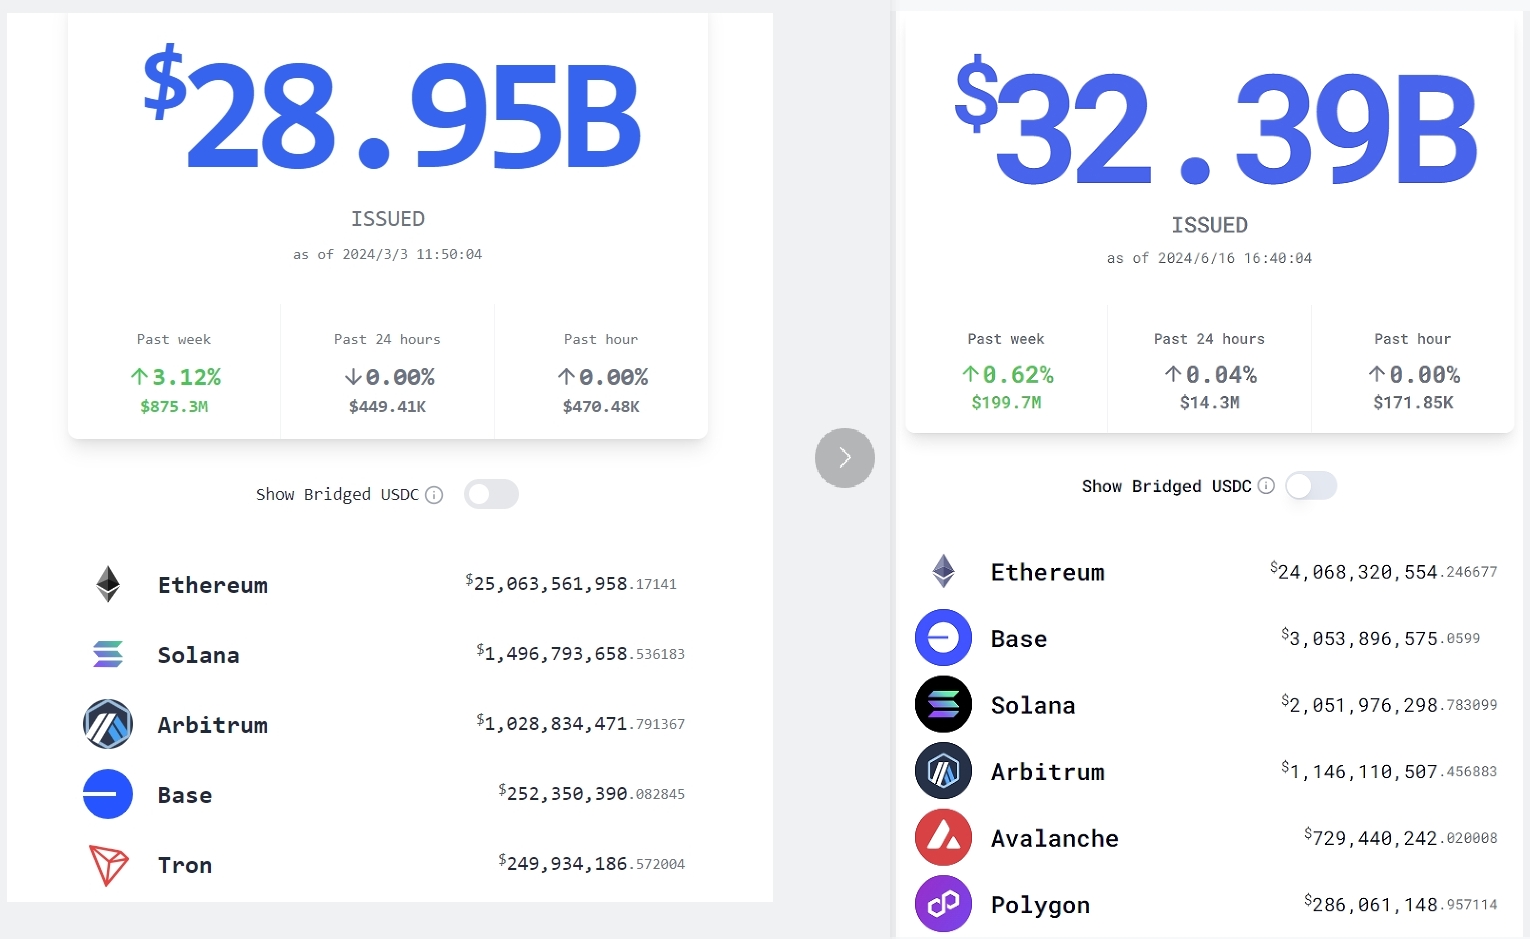
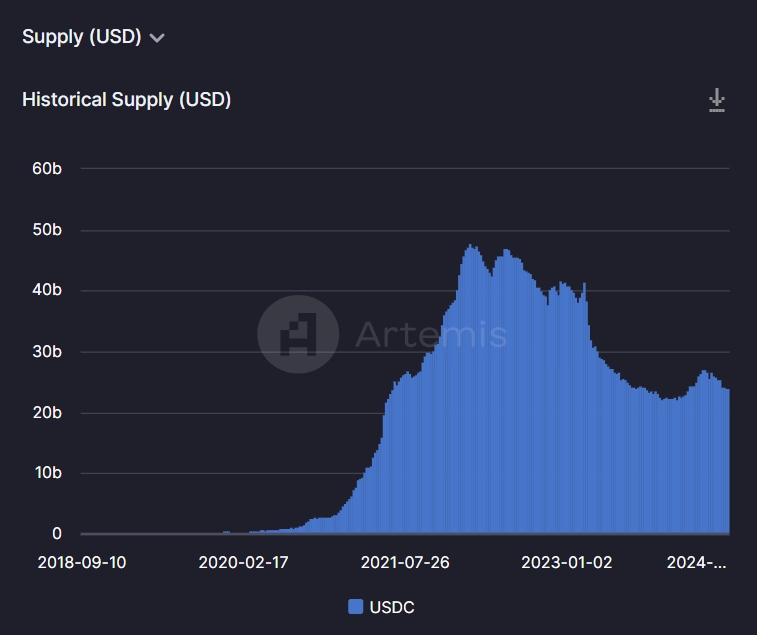
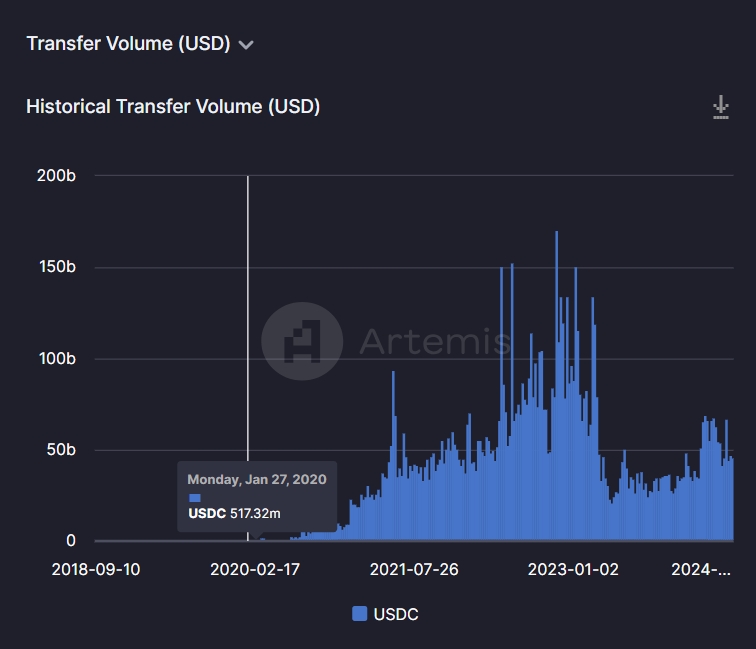
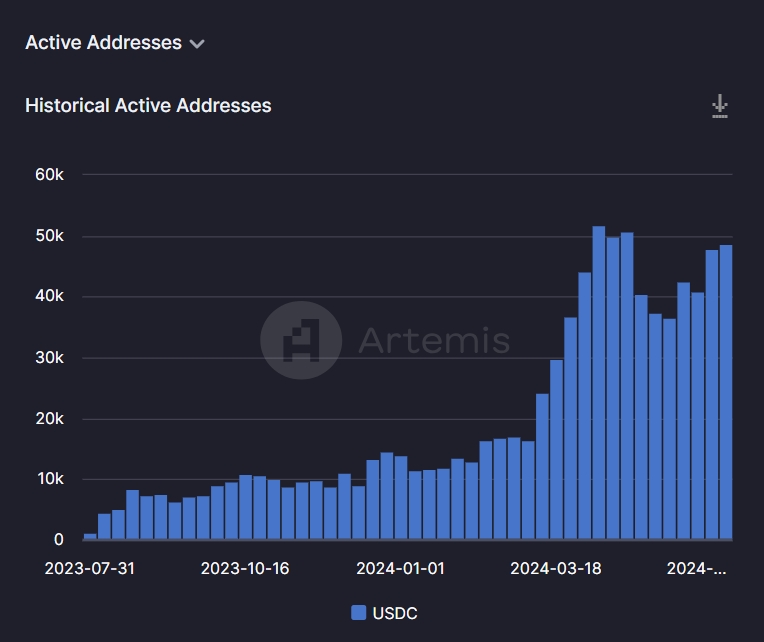
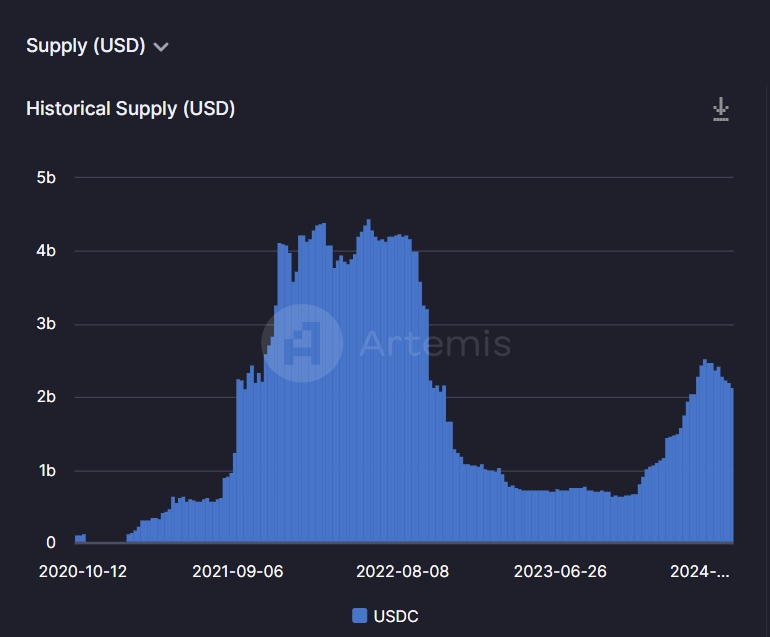
USDC data has changed significantly compared to March, as shown in the figure below, with March data on the left and June data on the right. It can be seen that the total amount increased from 28.95 billion to 32.39 billion, an increase of about 3.4 billion US dollars. The amount of USDC on Ethereum decreased by 1 billion US dollars, the amount of USDC on Base increased by 2.8 billion US dollars, the amount of USDC on Solana increased by 550 million US dollars, and the changes on other chains were relatively small.
As for the USDC supply on Ethereum, the overall trend rebounded in March and then continued to decline. It is speculated that this is related to the fact that there are fewer playable and profitable projects on the main network. Currently, the activity on the Ethereum main network is very inactive, and the Gas Price often drops below 5 Gwei.
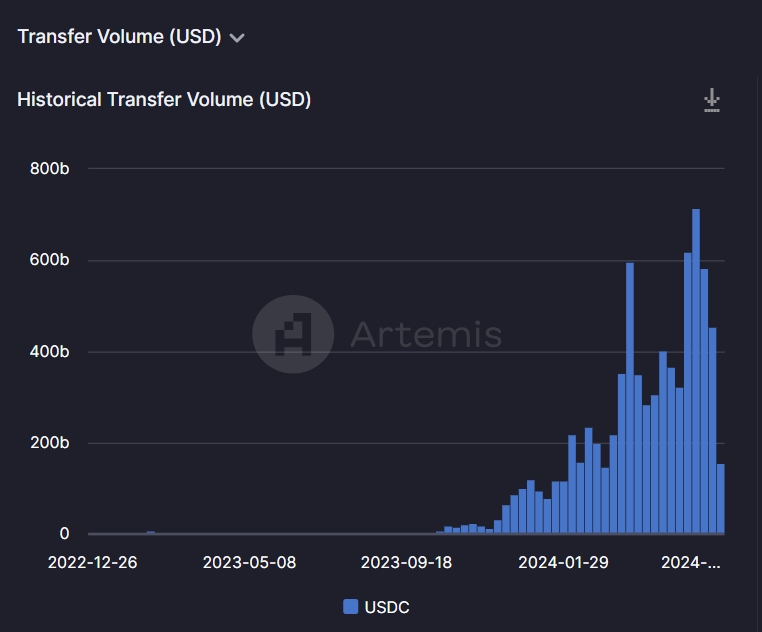
Transfer volume also declined:
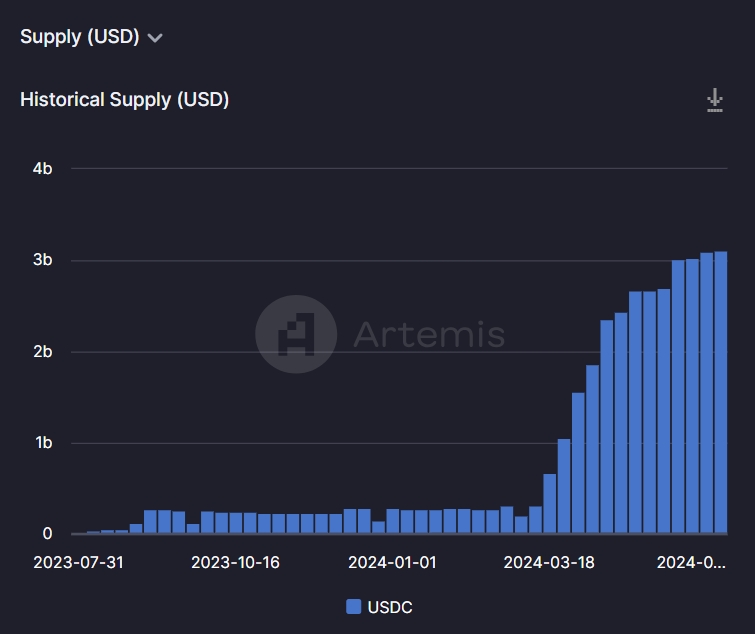
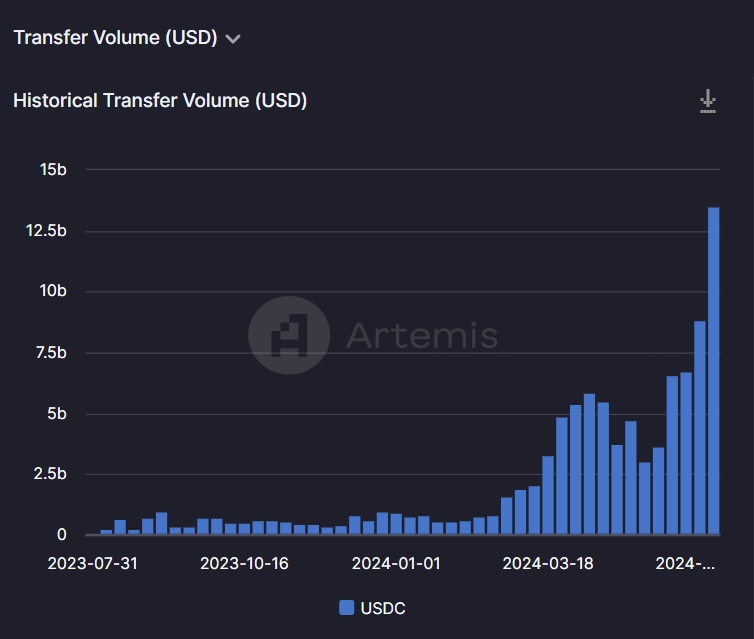
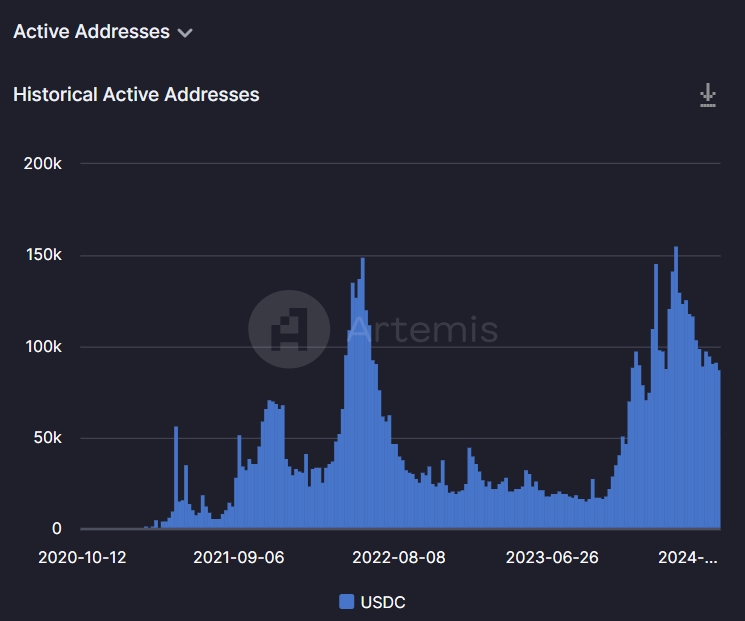
In contrast, the USDC supply and transfer volume of the Base chain has continued to increase since March, and the number of active addresses has declined and then rebounded.
For USDC on Solana, its supply, transfer volume, and number of active addresses have all fallen since reaching a high point in late April:
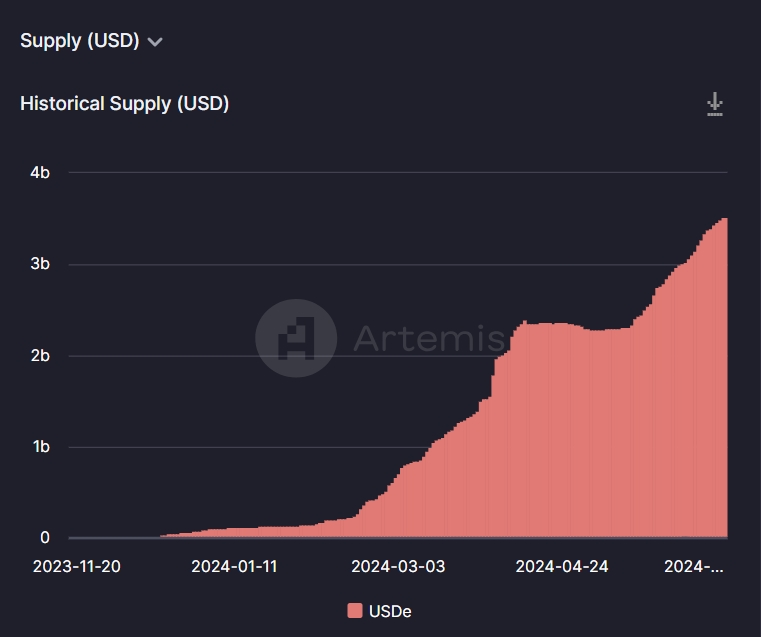
USDe data
The supply of USDe has grown rapidly in recent months, starting in March and continuing to grow to the current 3.5 billion.
But the transfer volume, number of transfers and number of active users are not very high:
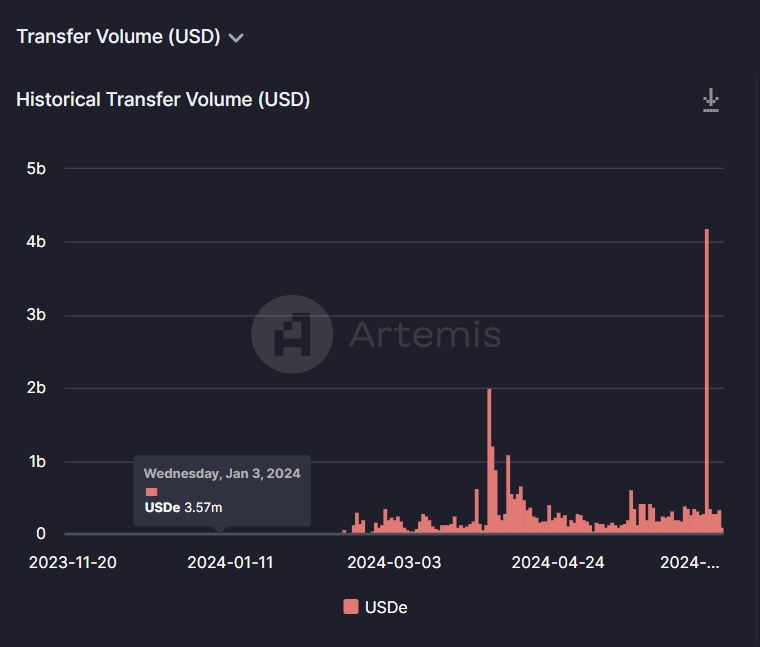
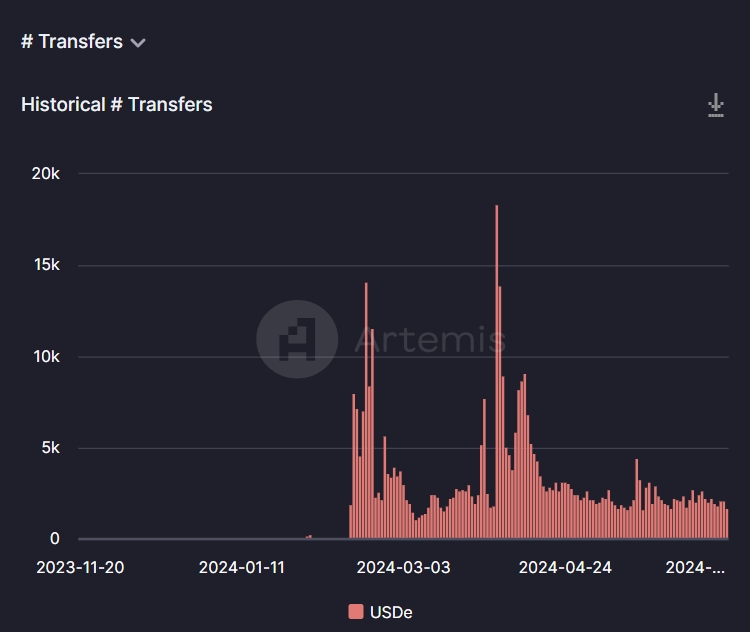
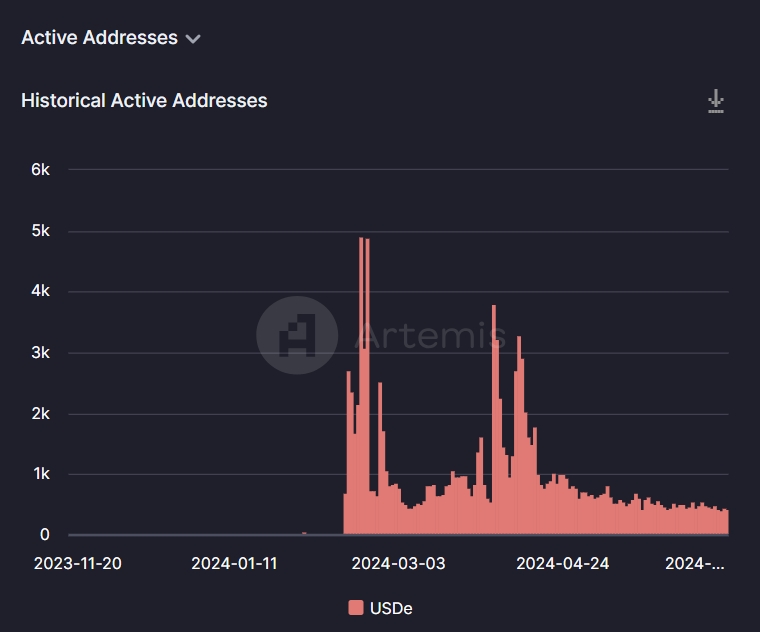
Its daily transfer volume is US$200-300 million, the number of transfers is approximately 2,100, and the number of daily active users is approximately 500.
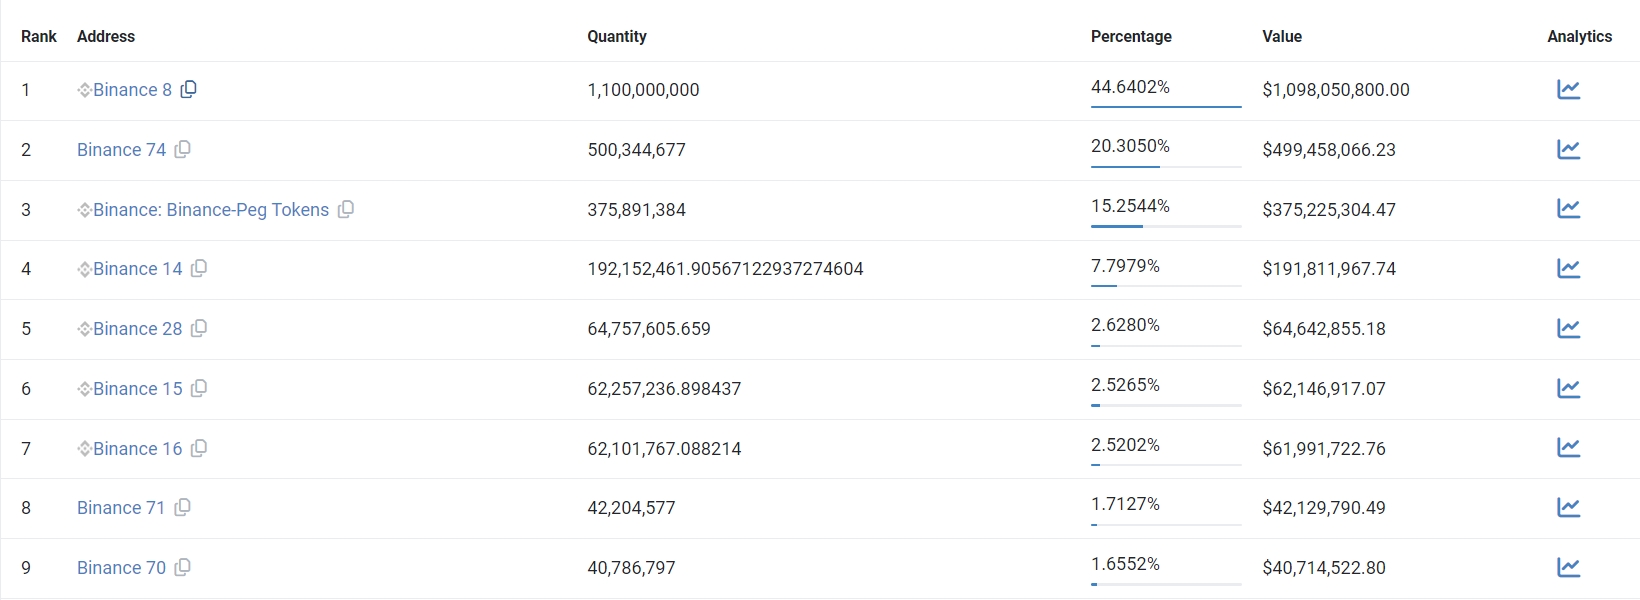
According to Etherscan data, USDe TokenThe top ten addresses by holdings are as follows:
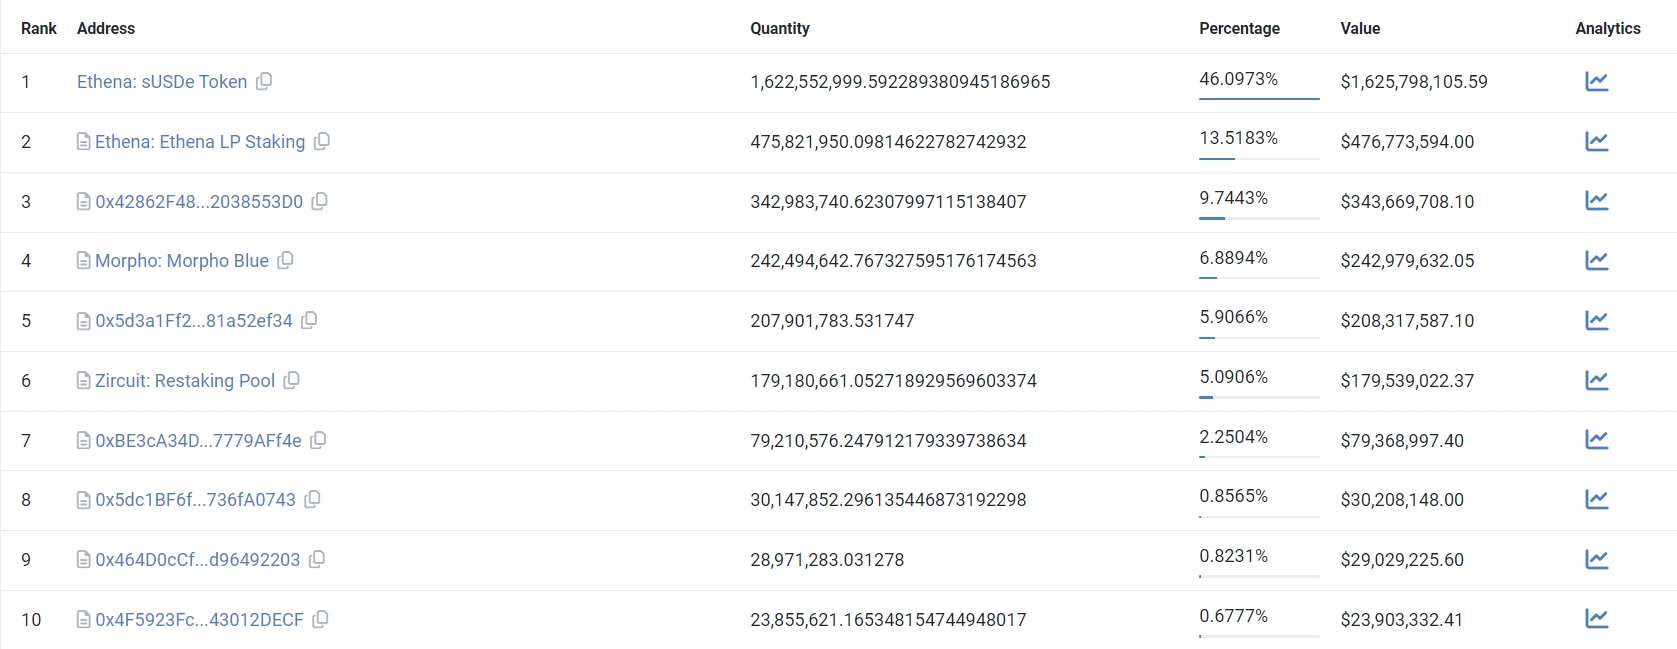
The first one is the USDe staking address, holding 46% of USDe.
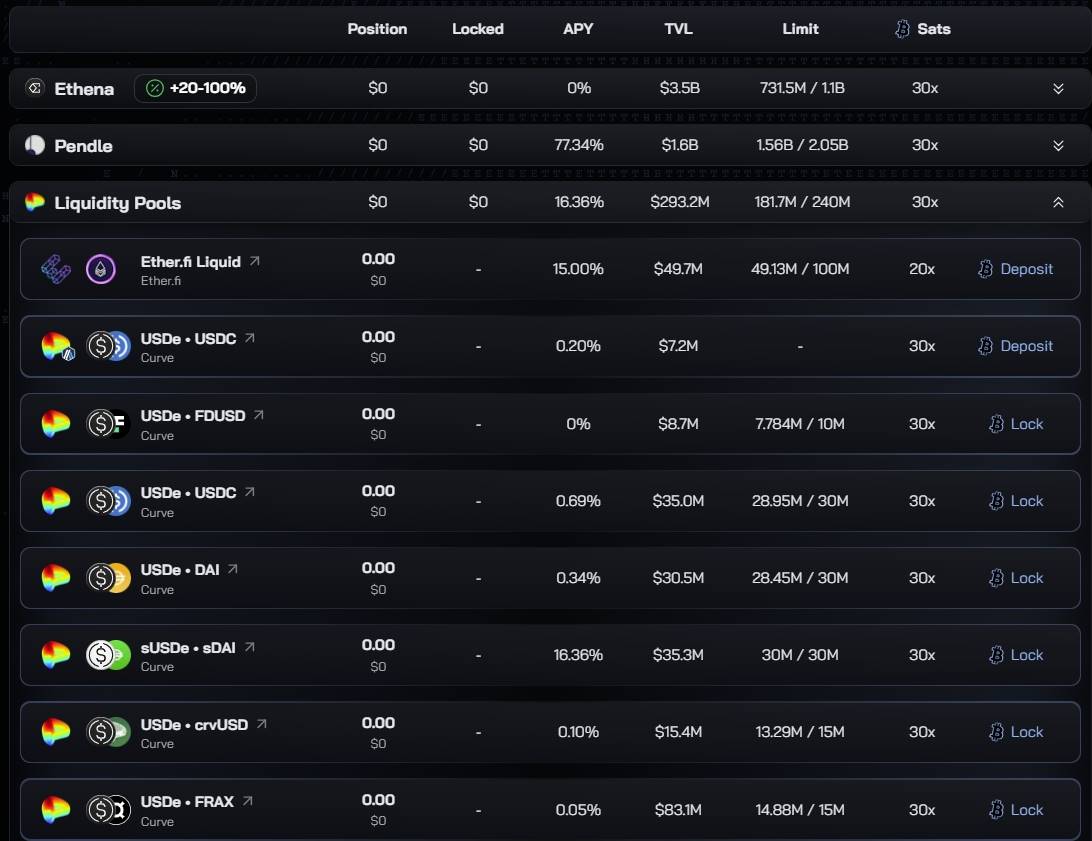
The second place is the locked address of ENA, USDe and related LPs, LPs are mainly concentrated on Curve. This address holds 13.5% of USDe.
The third place is the corresponding SY of USDe on Pendle contractThis address holds 9.7% of USDe.
The fourth is borrowingcontract The contract address of Morpho Blue,Morpho BlueIt is a trustless and efficient lending primitive that allows users to create a lending market without permission. Users can customize loan assets, collateral assets, liquidation loan-to-value ratio (LLTV), oracles, and interest rate models (IRM).
该地址持有大量 USDe 的原因是用户可以在 Morpho 上抵押 USDe 和 sUSDe 来借出 DAI 和 USDT:
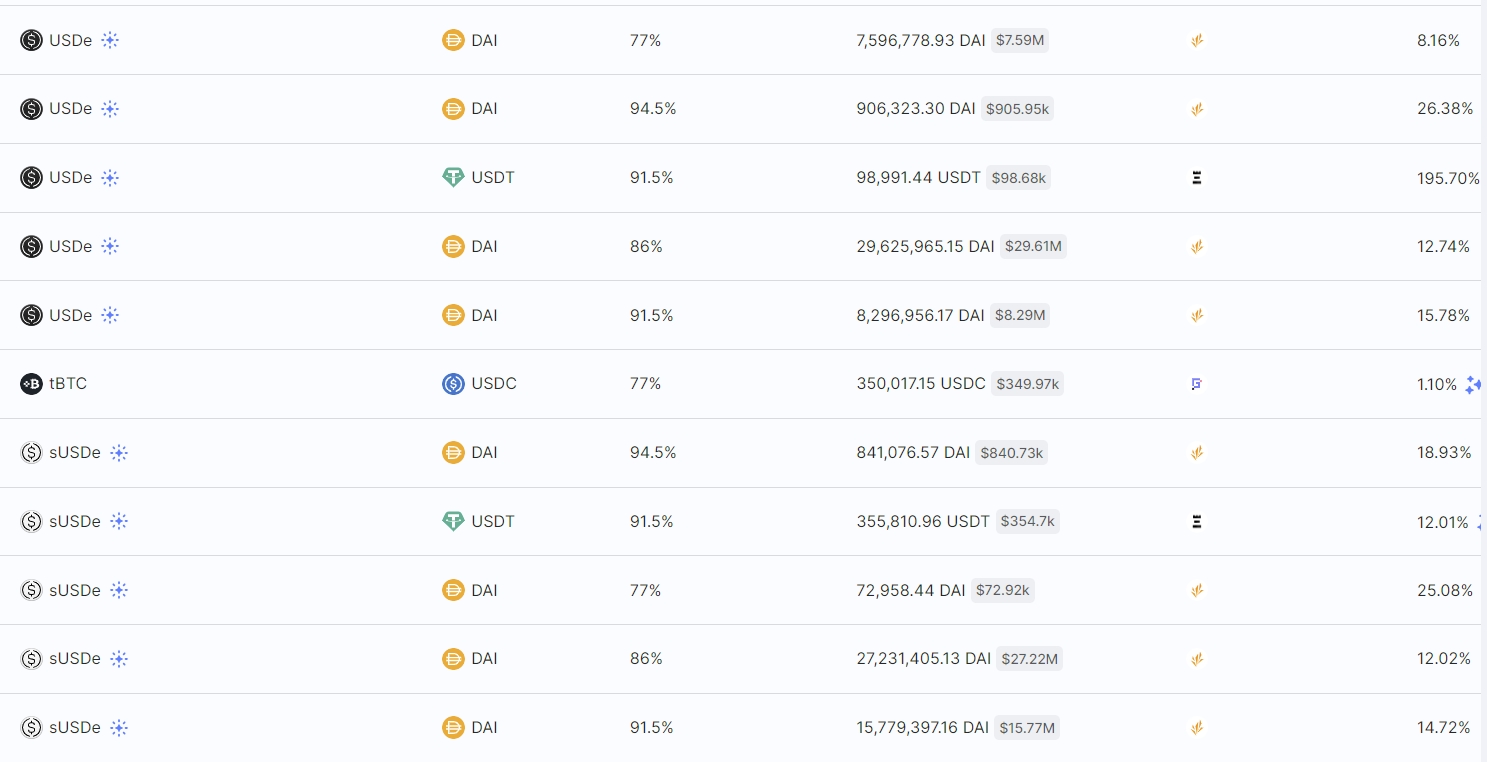
利用 Morpho 抵押 USDe 借出 DAI 可以比较方便的叠加杠杆。这部分持有约 6.9% 的 USDe。
The fifth is the LayerZero cross-chain contract address of USDe, which holds 5.9% of USDe.
It can be seen from the on-chain activity data and position data of USDe that USDe is currently mainly circulating within the entire system. There are very few cases where USDe is actually used as a means of payment or transaction medium. This is also a problem faced by many stablecoins before.
FDUSD and TUSD Data
The supply trend of FDUSD is shown in the figure below. After reaching a peak of 4 billion at the end of April, it continued to decrease to 2.17 billion.
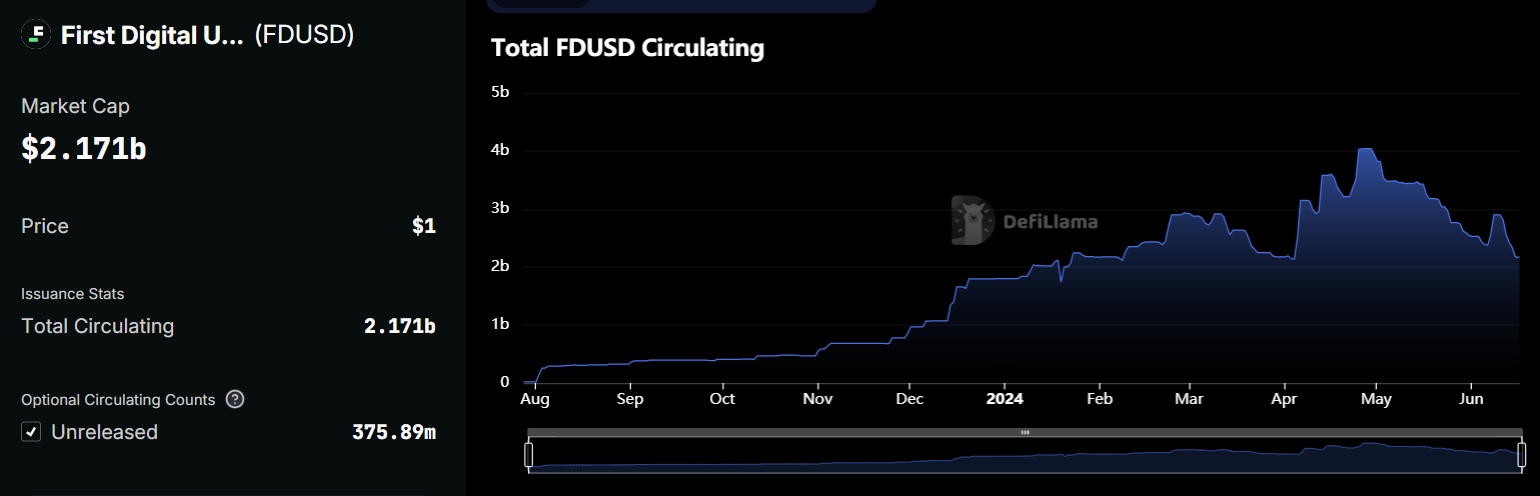
Most of FDUSD isBinanceHold, the main use scenario is forBinanceexchange内部的交易以及 LanchPool 获取奖励。FDUSD 总量的减少能在一定程度上反应币安交易所用户的活跃降低。
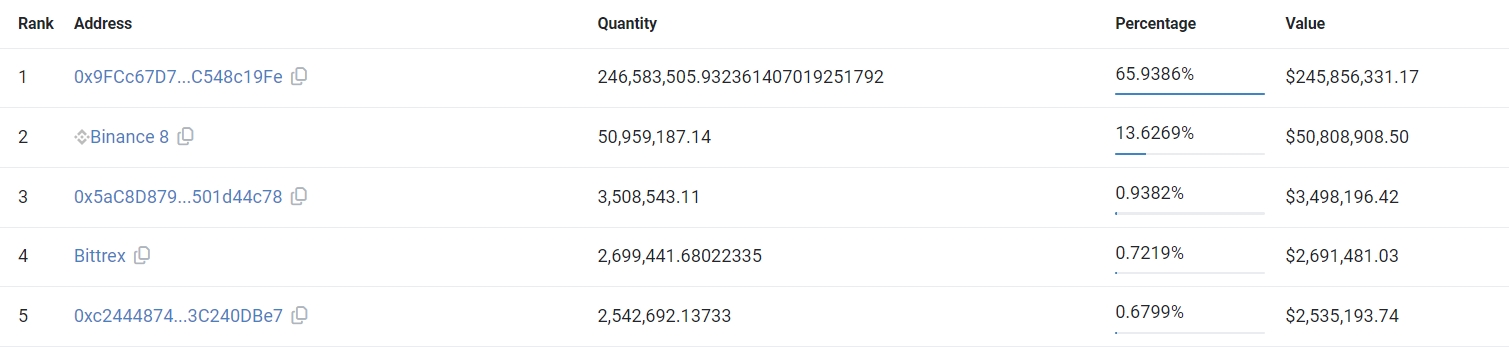
For TUSD, the total supply has remained basically unchanged after a continuous decline in March:
The largest holder of the address is Brother Sun, accounting for 66%, followed by Binance with 13.6%.
[Disclaimer] There are risks in the market, so investment needs to be cautious. This article does not constitute investment advice and users should consider whether any opinions, views or conclusions contained in this article are appropriate for their particular circumstances. Invest accordingly and do so at your own risk.
The article comes from the Internet:Analysis of on-chain stablecoin data in June: total market value increased, with issuance mainly concentrated in TRON and Ethereum
Related recommendations: Understanding modularity in one article: pluggable solutionsBlockchainPerformance bottleneck
Modular technology represents a more "soul-oriented" pluggable product idea. Written by: @twilight_momo Instructor: @CryptoScott_ETH TL;DR MonomerBlockchain以全面性著称,独立承担网络的各个层面,从数据存储到交易验证等等。而模块化区块链通过将区块链的不同功能分离…