Glassnode Chain Report: Digesting the Impact of GBTC Excess Supply
Written by: Ding HAN, UkuriaOC
Summary
-
Bitcoin price performance since the 2022 lows has been strikingly similar to previous cycles, albeit with a slightly slower, more resilient recovery.
-
Although selling of old coins increased slightly after the ETF was approved, most long-term Bitcoin investors are still unwilling to sell their Bitcoins at current prices.
-
Network activity is still low in terms of entities, but the amount of currency being moved on-chain, especially toexchangeMoney volumes remain strong, similar to previous bull cycles.
Cycle positioning
The first chart evaluates BTC’s price performance since its last all-time high. In this case, we consider April 2021 (Coinbase direct listing) as the all-time high to better interpret duration, as we believe that is the peak of investor sentiment.
History rhymes surprisingly well, and Bitcoin’s performance over the past 3 cycles has been extremely similar. Our current cycle is still slightly ahead of 2016-17 and 2019-20, in part because 2023 is an extremely strong year.
Cycle 2: Lower than the previous historical high of 45.7%
Cycle 3: Lower than the previous historical high of 43.6%
⚫Current cycle: lower than the previous historical high of 37.3%
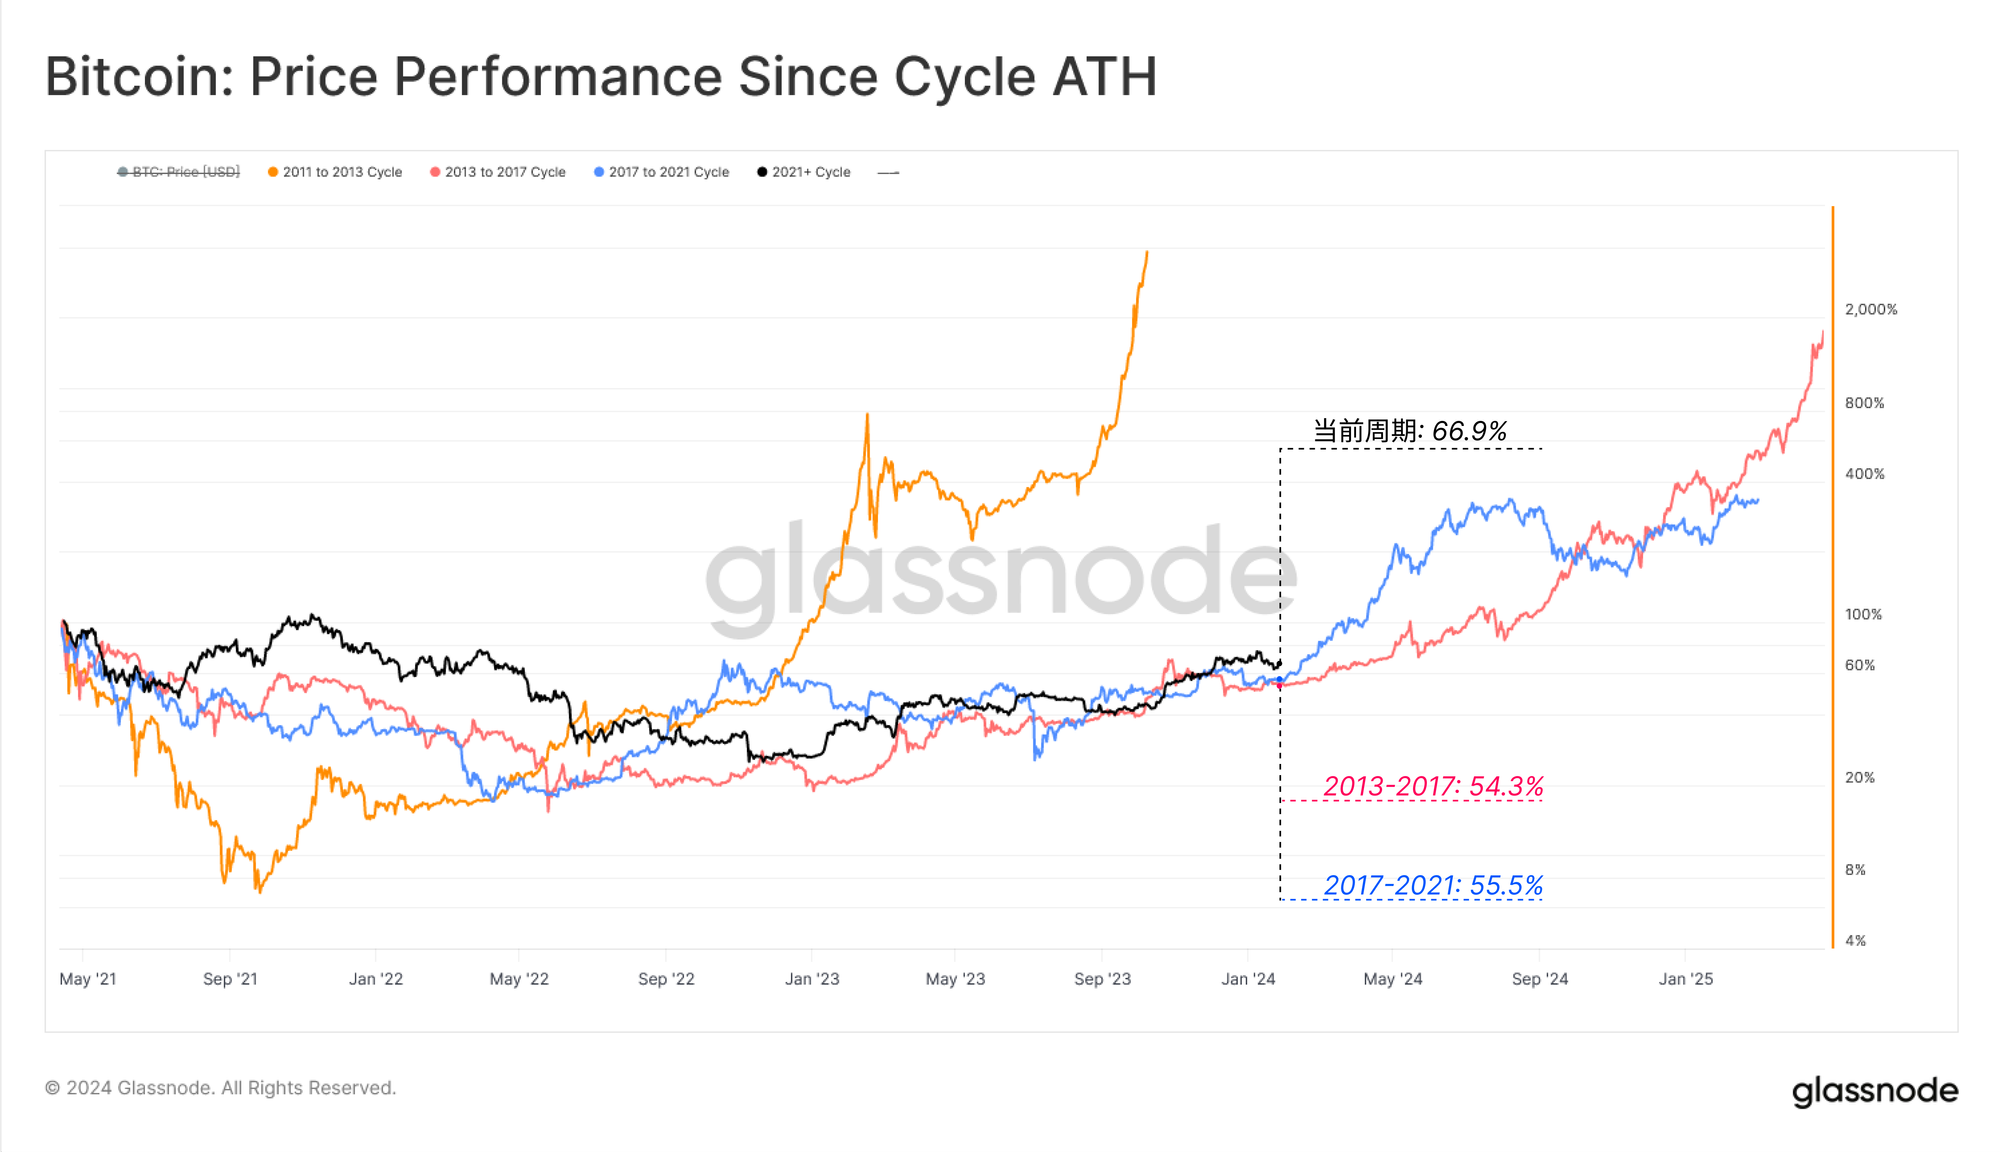
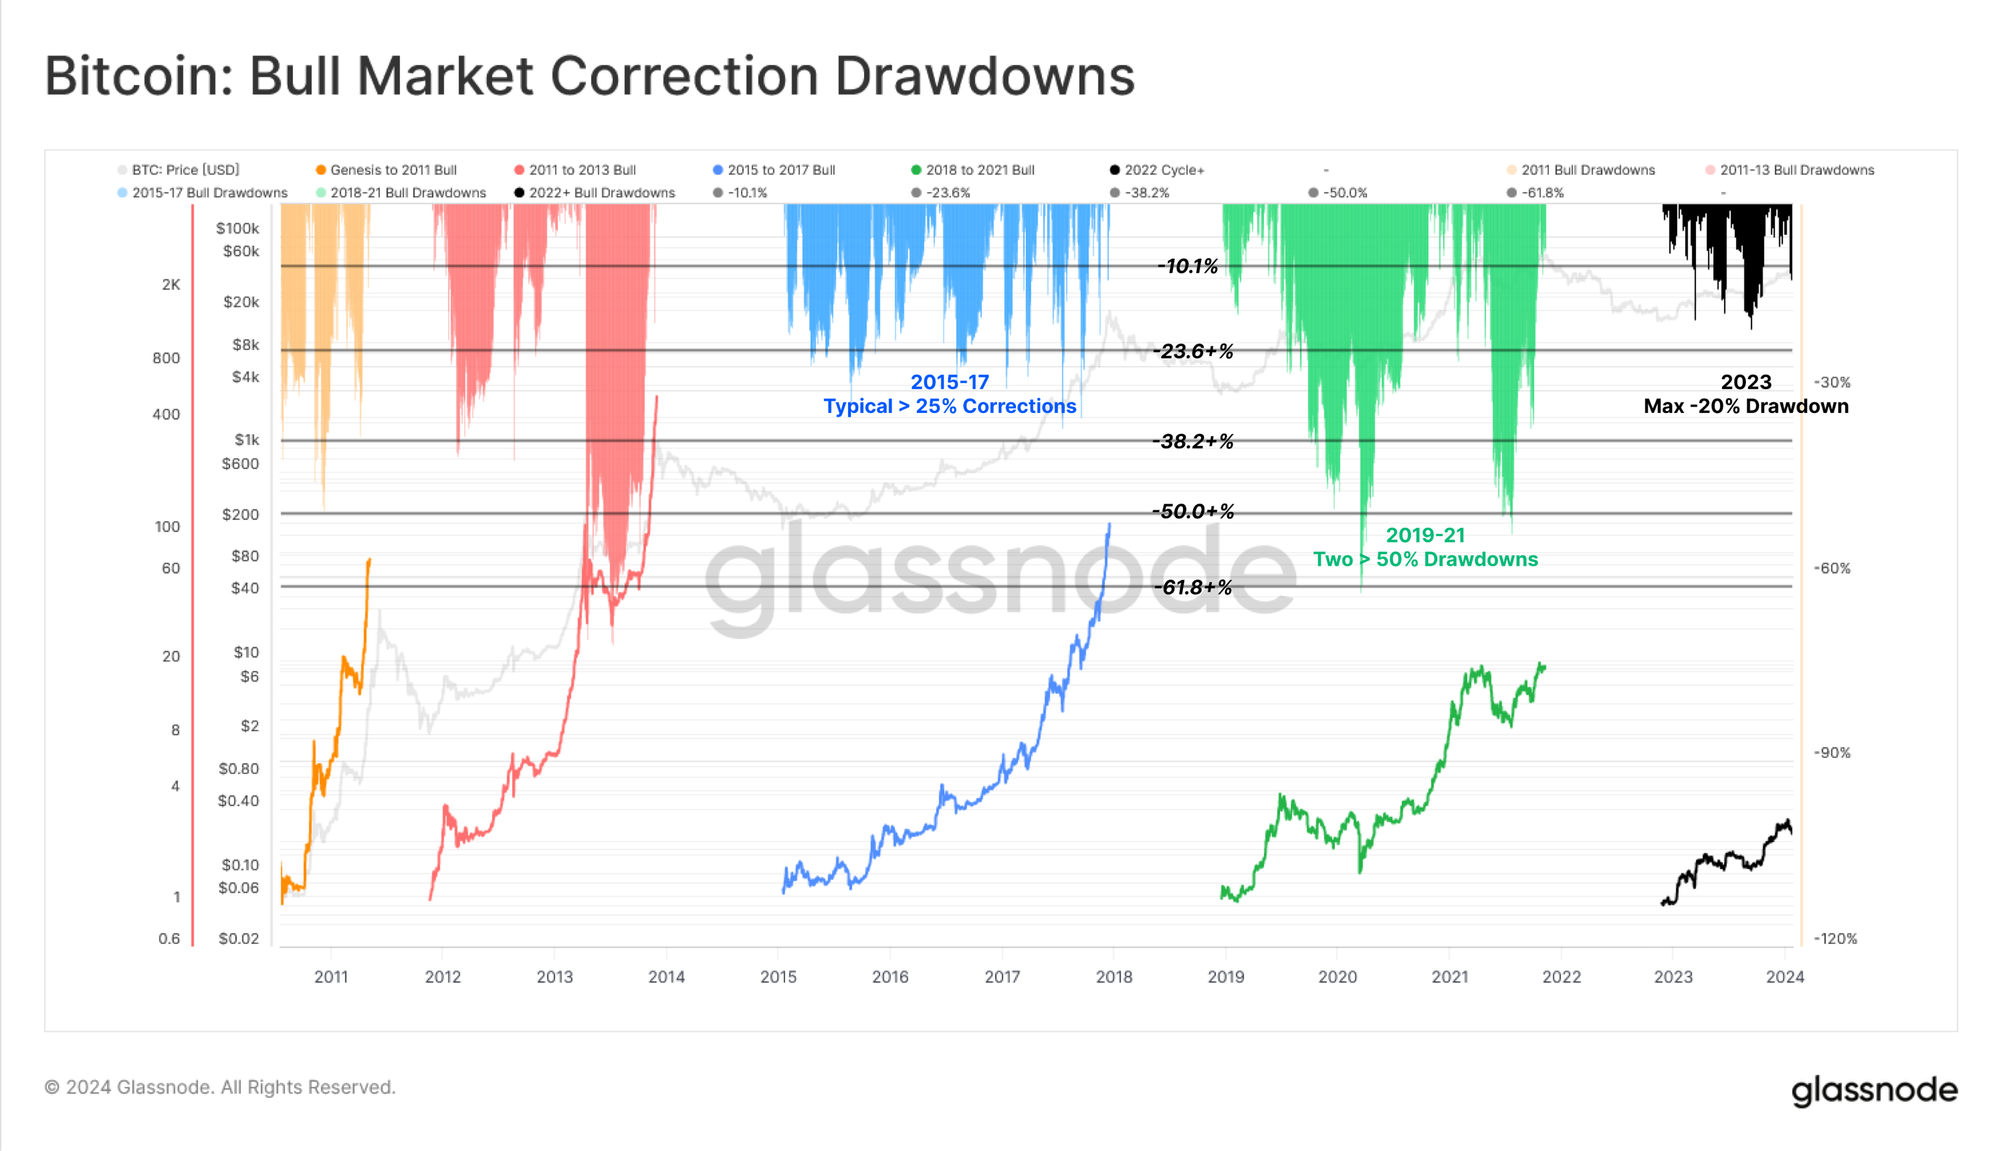
However, in our current cycle, a higher level of resilience can be noted, with corrections from local highs remaining relatively shallow. The largest retracement to date was -20.1% in August 2023.
This insight becomes increasingly clear if we compare the proportion of days that trade during deep corrections:
Creation to 2011: 164–294 days (55.7%)
2011 to 2013: 352–741 days (47.5%)
2015 to 2017: 222–1066 days (20.8%)
2018 to 2021: 514–1056 days (48.7%)
Nonetheless, price momentum has been moving downwards in recent weeks as the market digests new developments in spot ETFs.
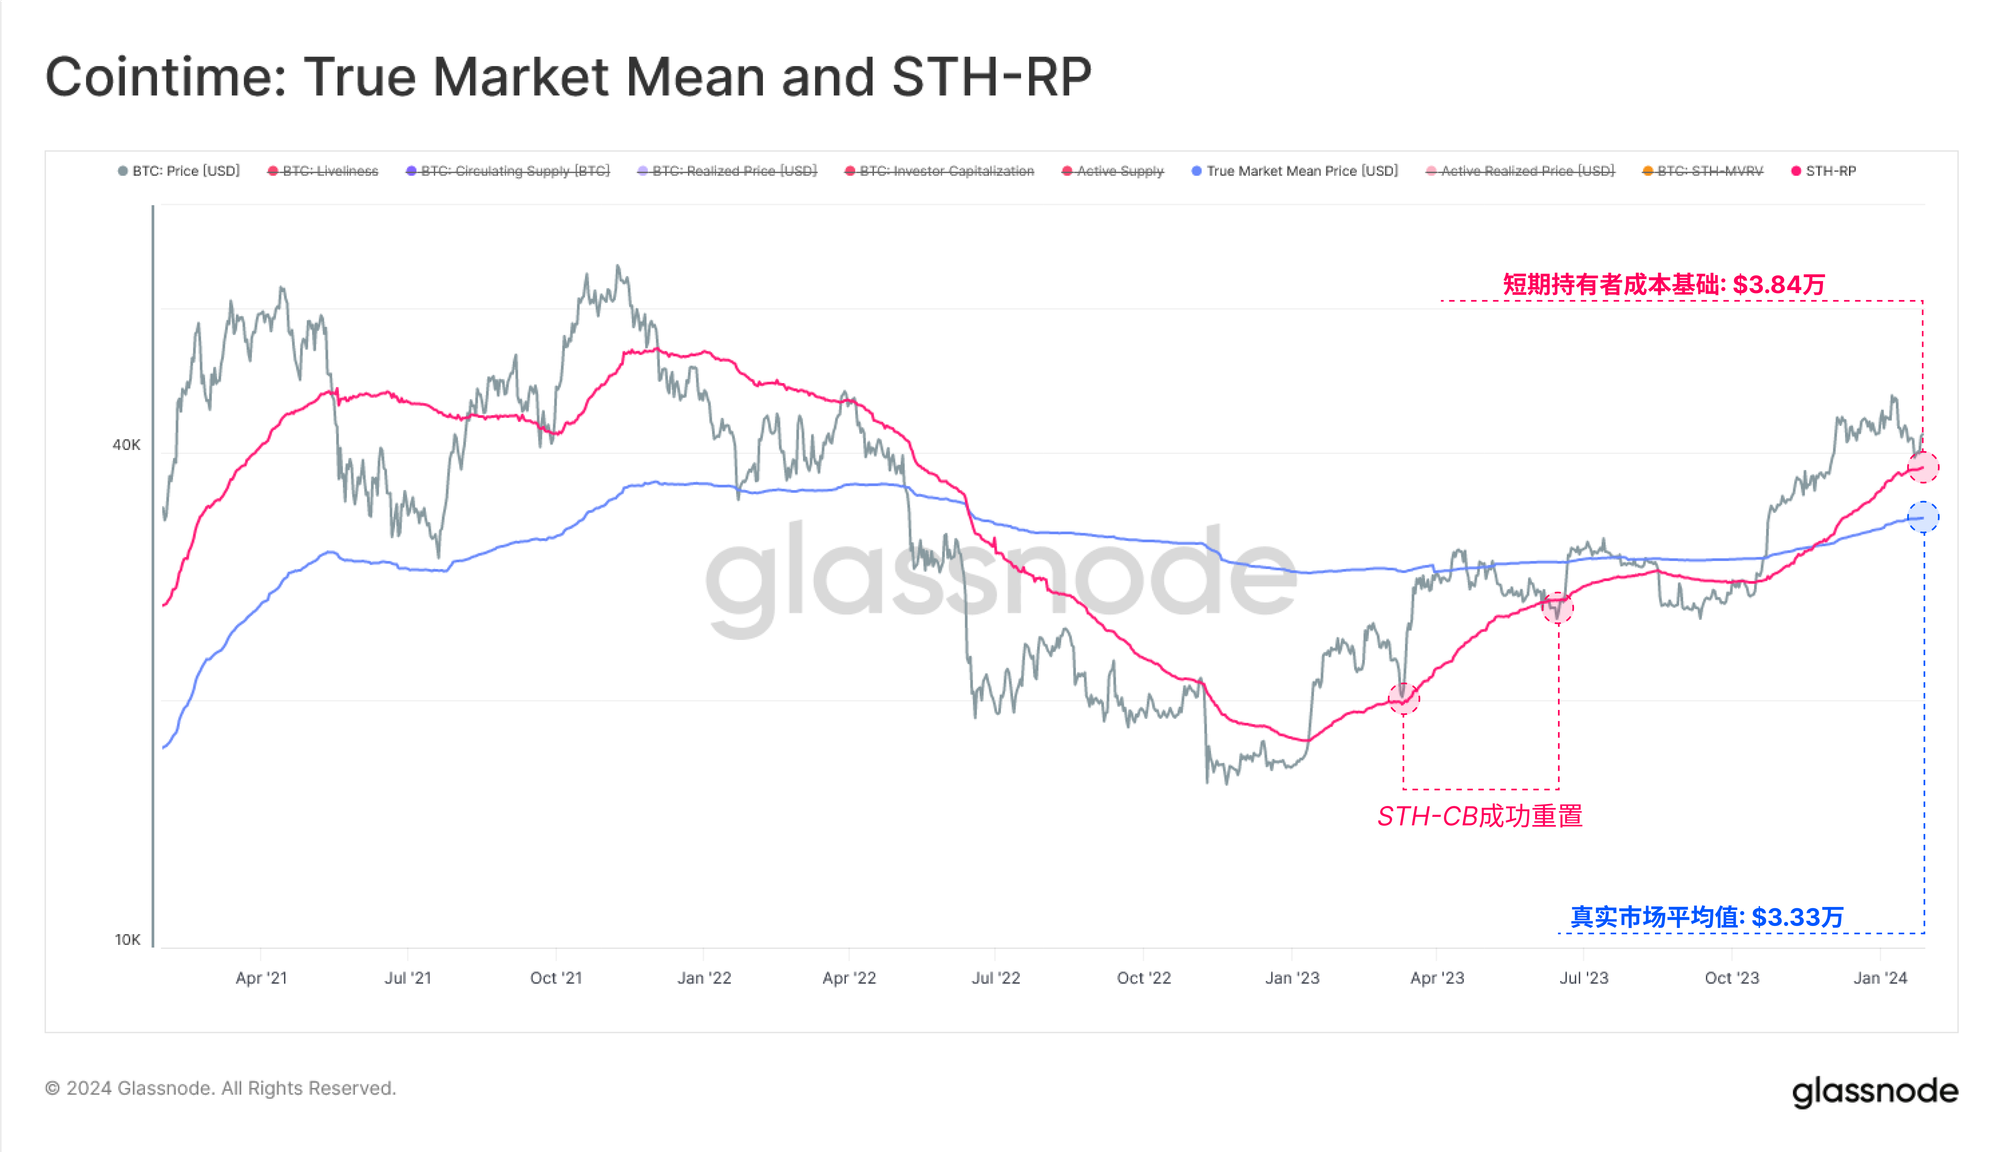
Here, we consult two key on-chain price points:
Short-term holder cost basis ($38,300), describing the average acquisition price for new demand.
Real market average price ($33,300), cost basis model for active investors.
In an uptrend, the short-term holder's cost basis is often retested as support, but if there is a decisive break below this level, the true market average price needs to be considered. The true average market price is to a large extent the "center point" of the Bitcoin market and can often distinguish between bull and bear markets.
Recovery encounters excess supply of GBTC
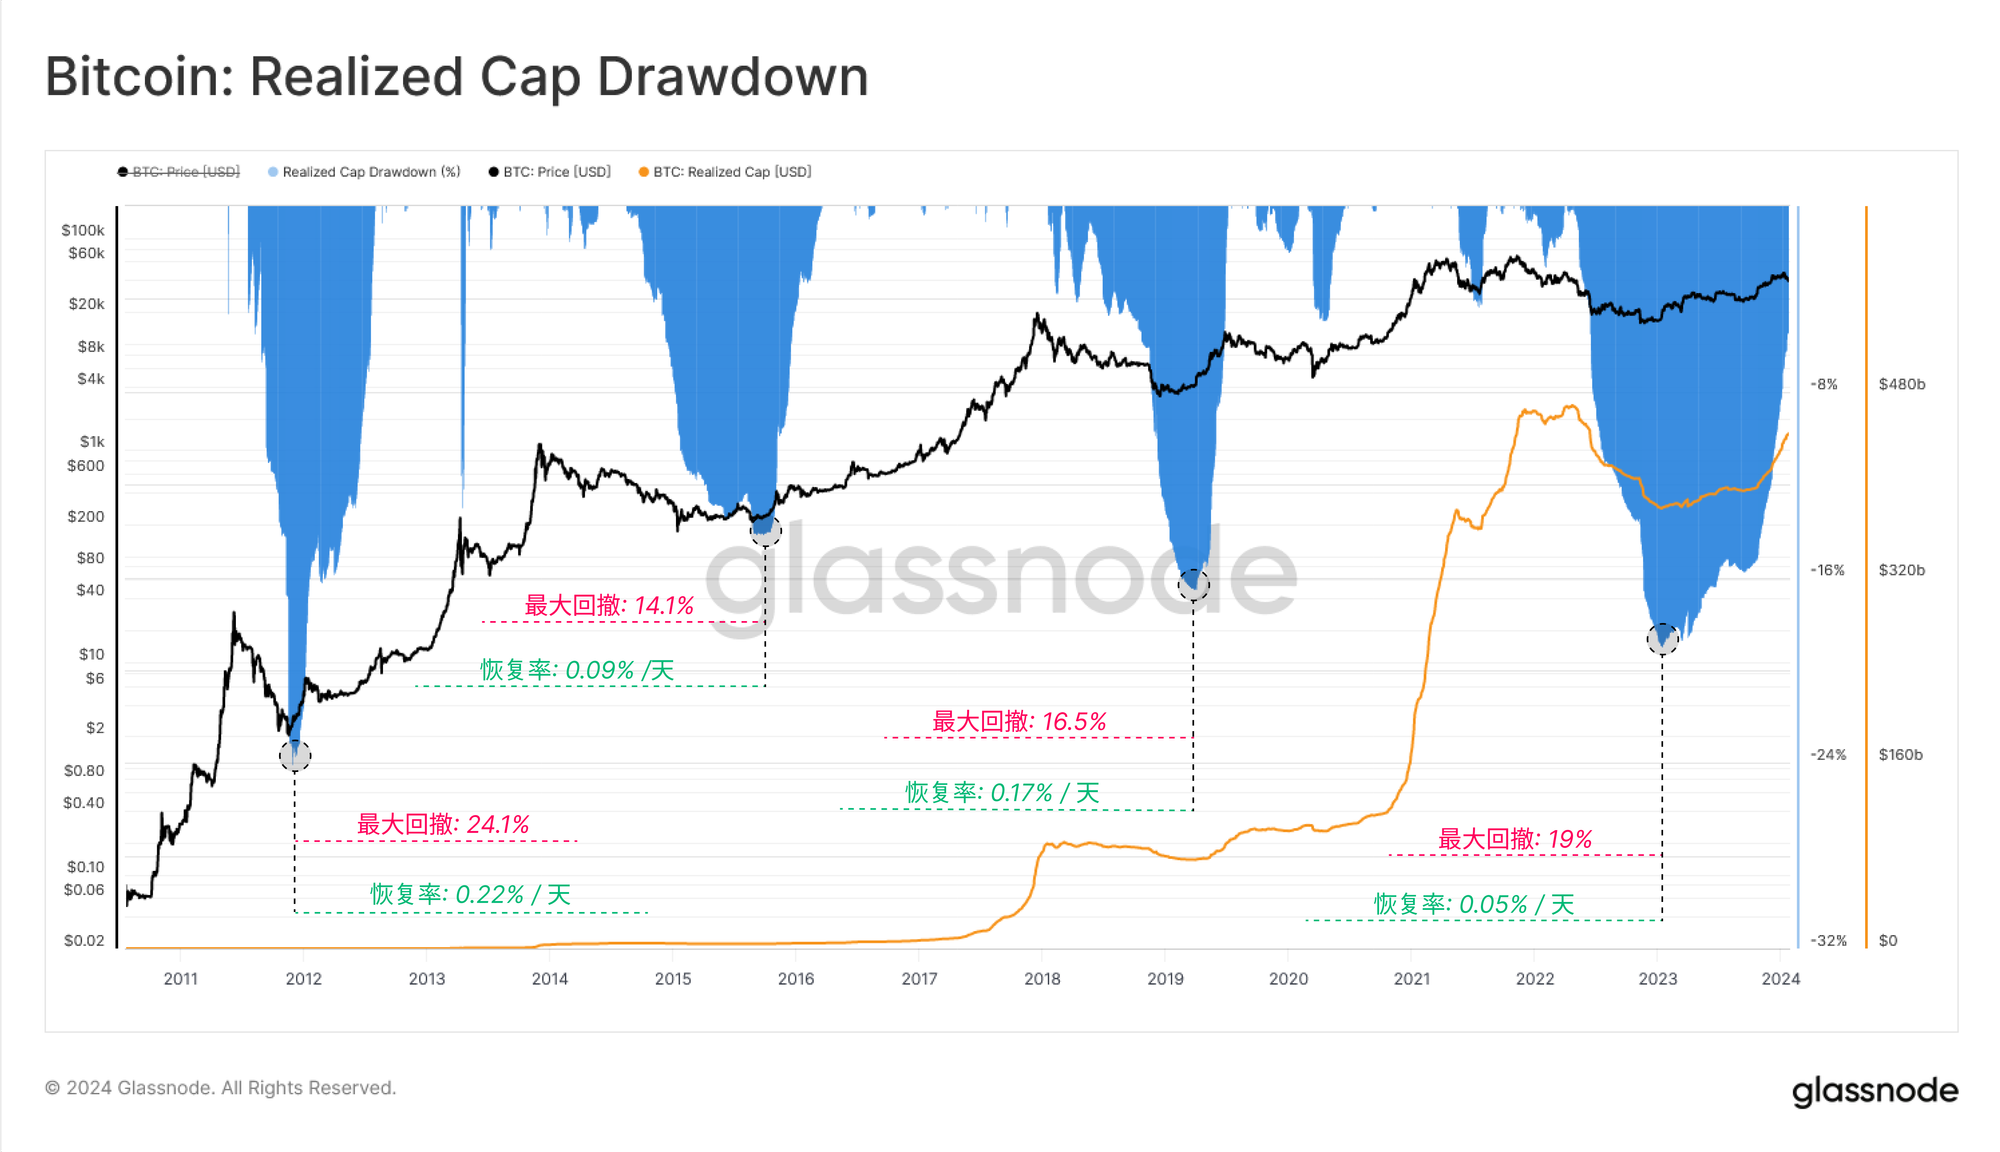
We can use basic "realized market capitalization" indicators to assess the severity of capital outflows in each cycle and the duration of the recovery.
Compared with the previous highest market capitalization of US$467 billion, the realized market capitalization is only 5.4% away, and it is currently experiencing strong capital inflows. Nonetheless, the recovery has been significantly slower to accelerate this time compared to previous cycles, likely due to the massive oversupply created by challenging trades such as GBTC arbitrage.
The recovery in realized market capitalization is the slowest on record this cycle
The 2012-13 cycle recovered 0.22% per day
2015-16 cycle: 0.09% per day
2019-20 cycle: 0.17% per day
2023-24 period: 0.05% per day
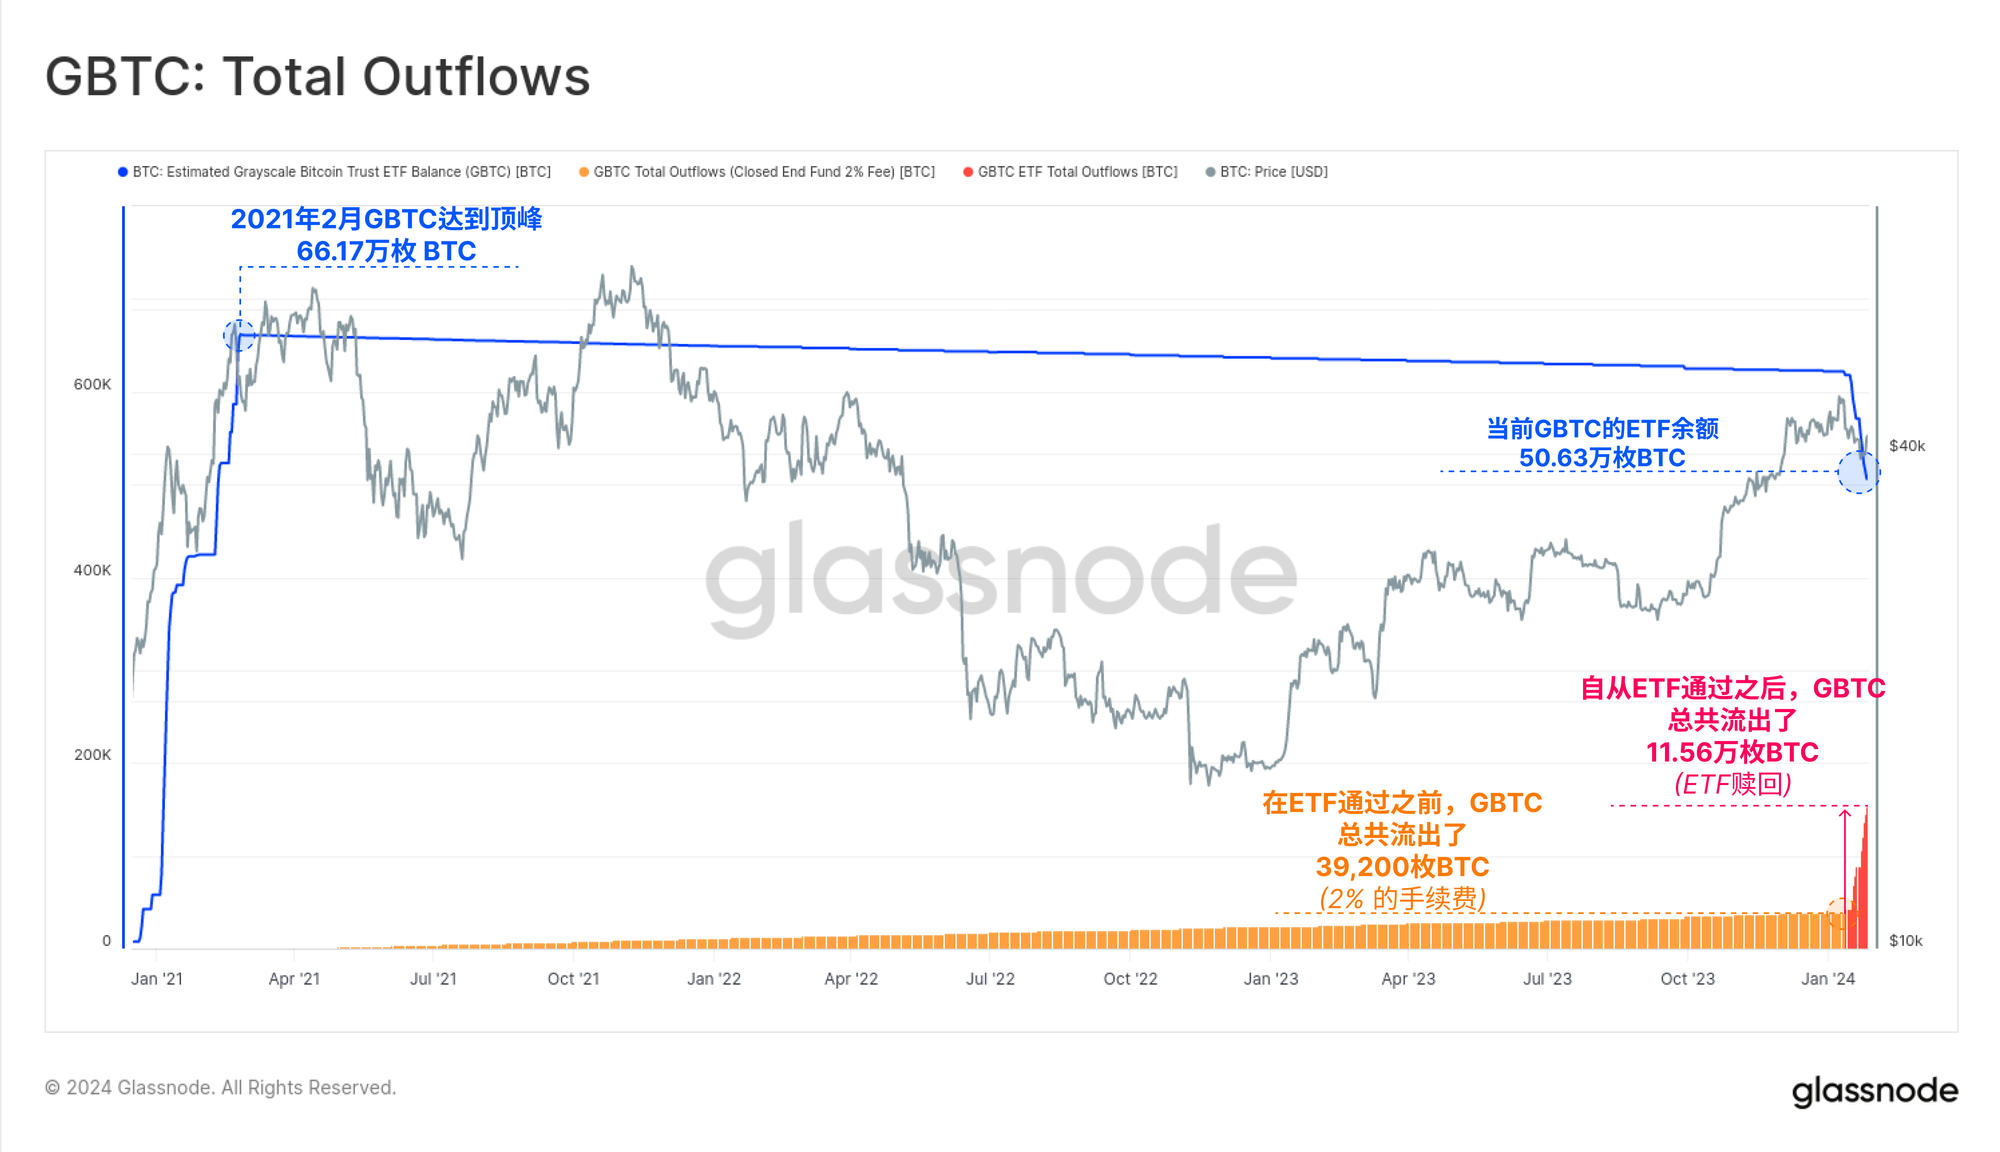
This phenomenon is partly attributed to the large redemptions of Grayscale GBTC products. As a closed-end trust, GBTC accumulated an extraordinary 661,700 BTC in early 2021 as traders attempted to close NAV premium arbitrage.
After years of trading at a severe discount to net value (2% had very high fees), the switch to spot ETFs triggered a major rebalancing event. Approximately 115,600 BTC have been redeemed from the GBTC ETF since the ETF was passed, creating a significant headwind for the market.
ETF hoarders are unwilling to relax
Amid strong rallies, sell-off news events, and dynamic markets, the vast majority of hoarders seem to be calmly riding the wave. This "last active supply" metric measures the proportion of circulating supply that has been held for many years.
We can see that the 1-year and 2-year volumes are down slightly, with a lot of the volume being related to GBTC, but not all of it being related to GBTC. This suggests that a significant amount of old supply has been flowing in recent weeks.
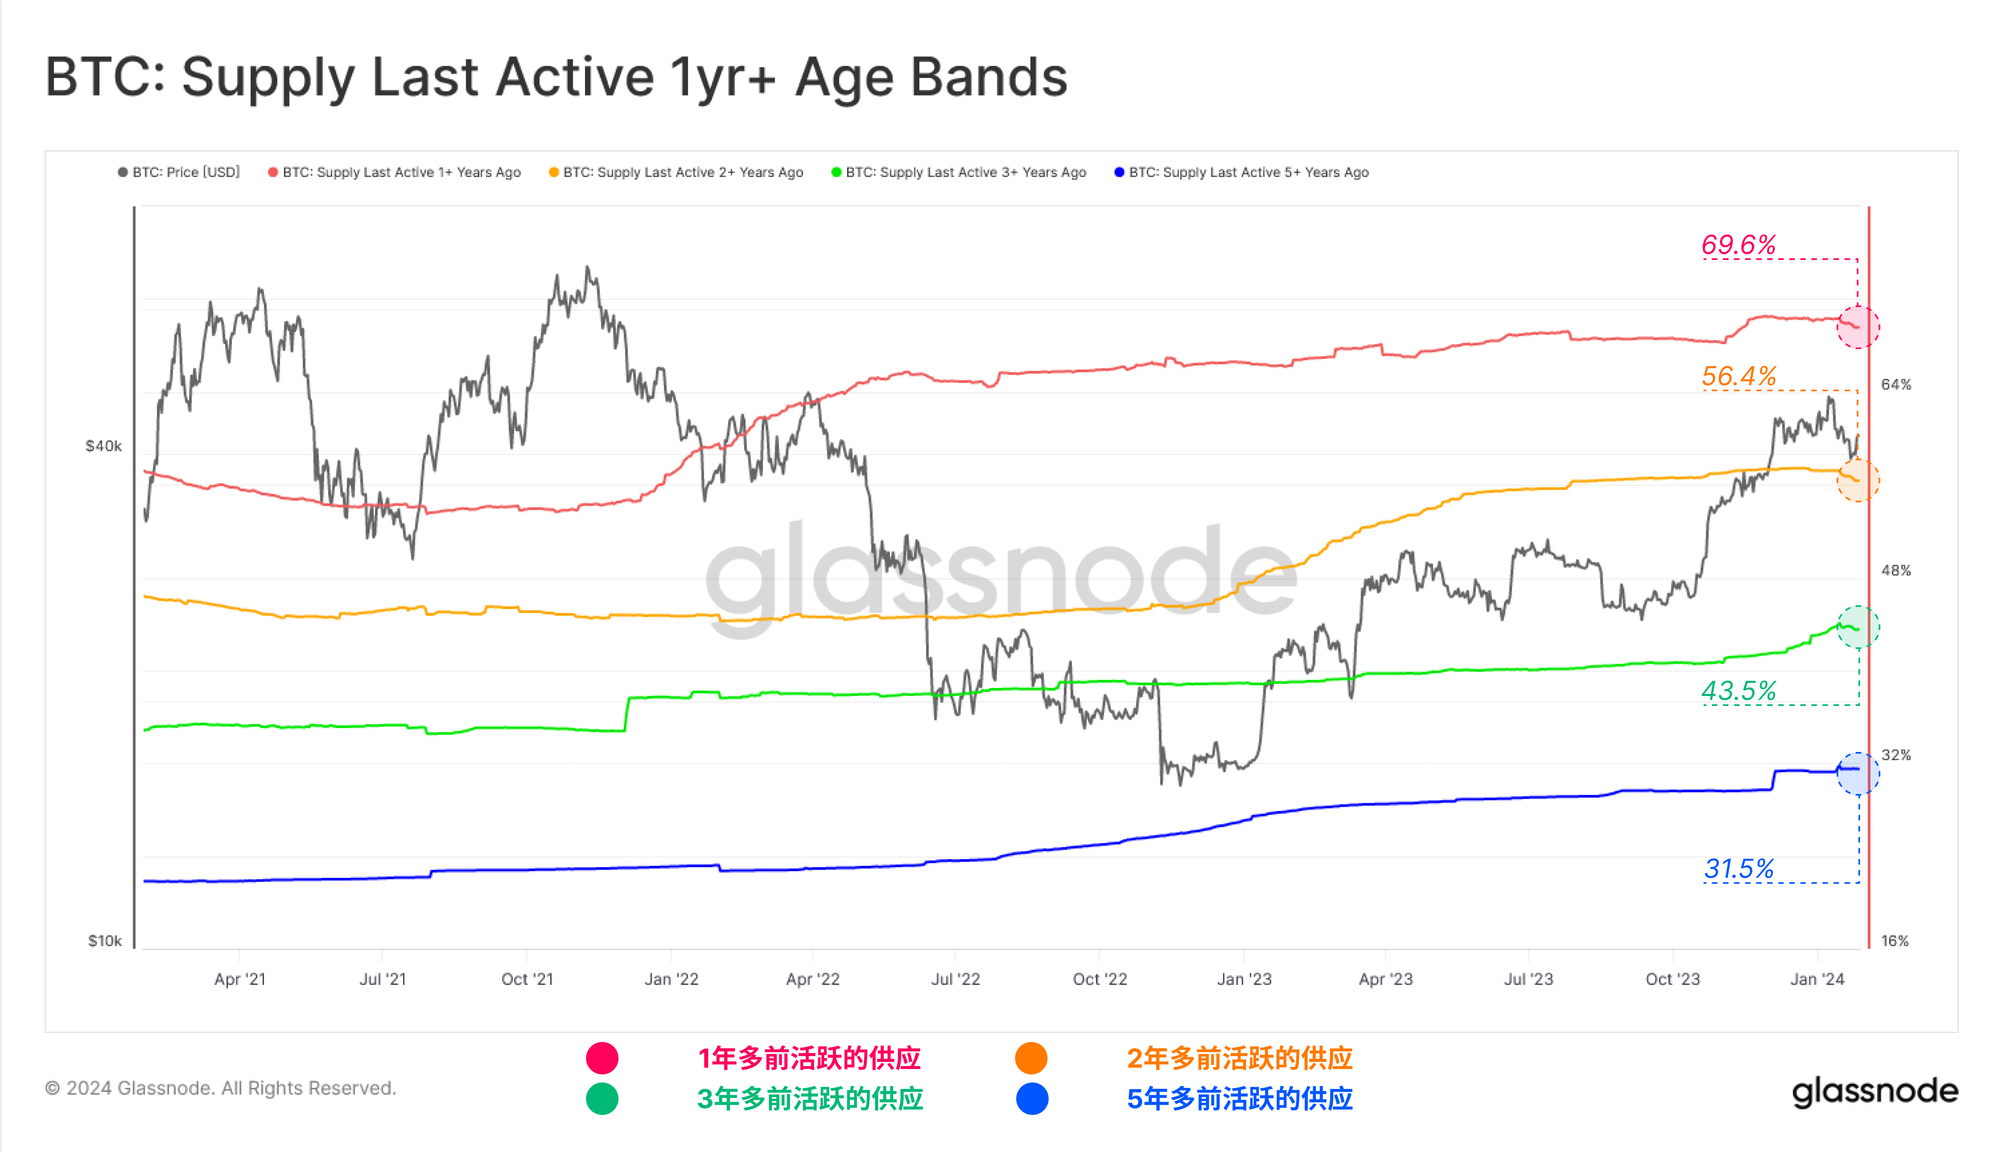
However, in terms of absolute numbers, the vast majority of BTC holders remain stable, and the proportion of holdings among multiple currency holding age groups is only slightly lower than the previous historical high:
over 1 year ago 69.9%
Over 2 years ago: 56.7%
over 3 years ago: 43.8%
Over 5 years ago: 31.5%
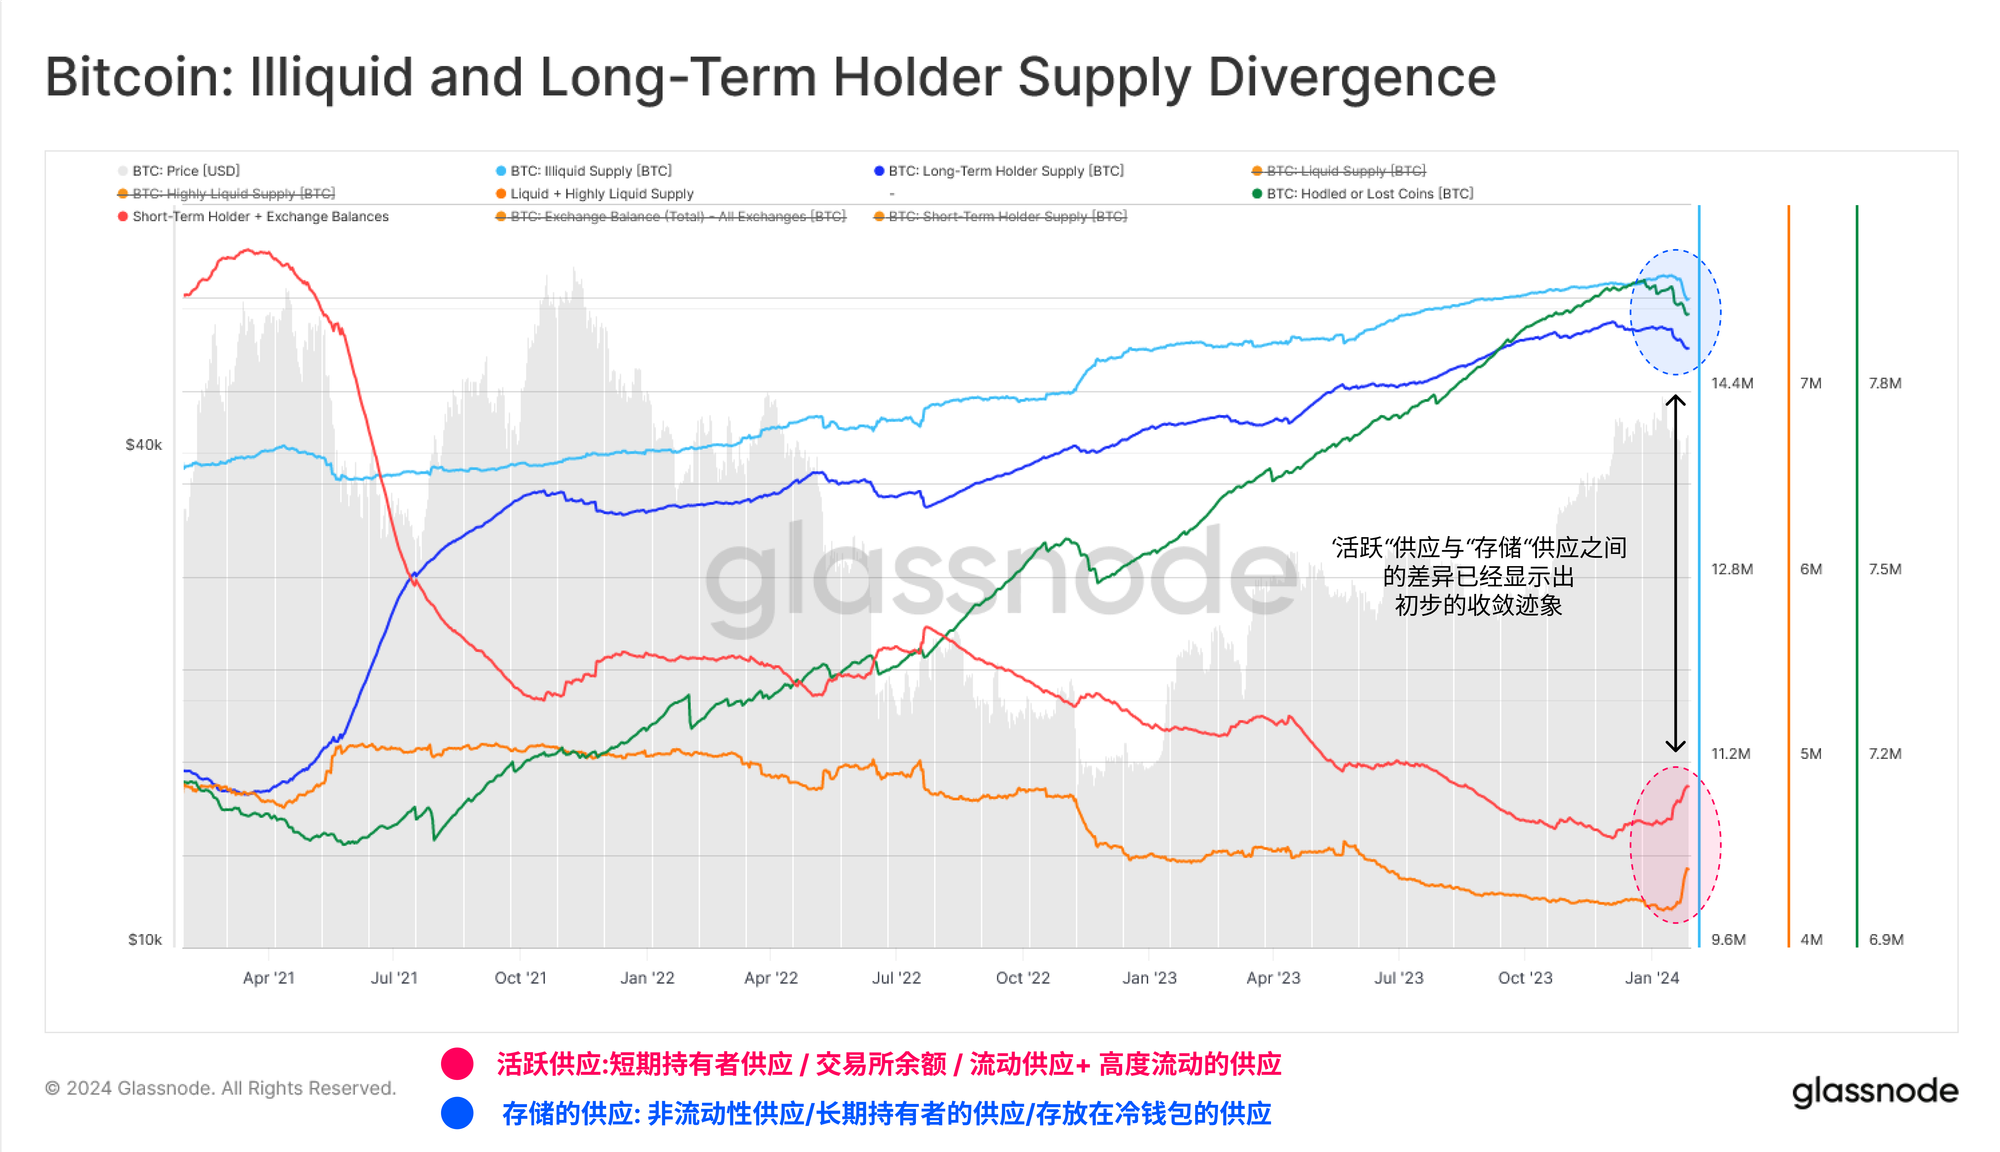
In the 46th weekly report of 2023, we introduced and compared several measures of "storage supply" and "active supply". At the time, we noticed a huge disparity between the two, with dormant, inactive, and illiquid Bitcoin predominating.
This year, we saw early signs that this divergence may be narrowing, with all indicators of "active supply" increasing significantly. This coincides with the previously mentioned rise in old coin selling.
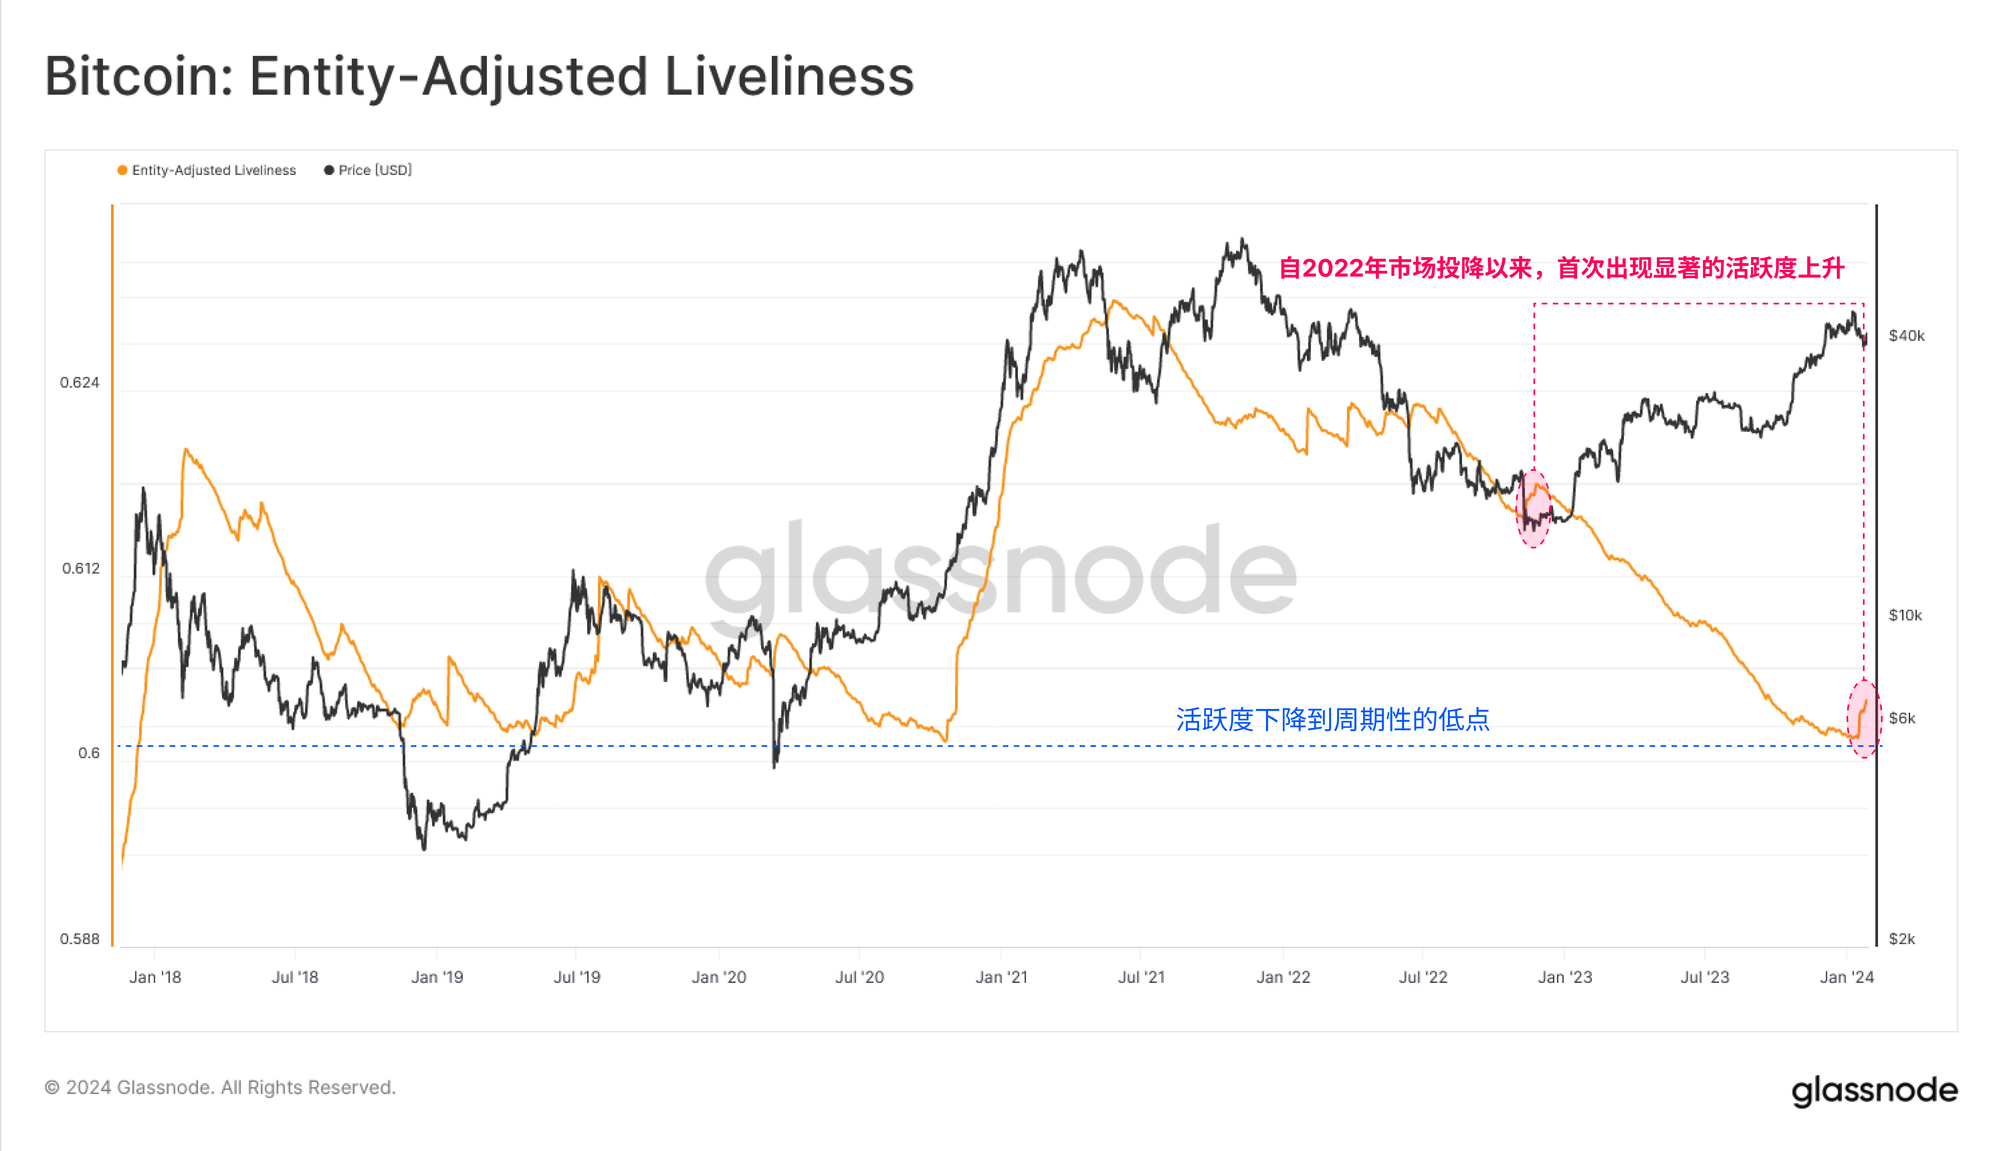
This triggered the largest increase in activity since the December 2022 capitulation event. This again supports the analysis above, showing an increase in Coinday burn as some investors give up some of their long-term Bitcoin holdings.
However, looking at the macro context, activity remains close to multi-year lows, suggesting that the vast majority of supply remains tightly controlled, arguably waiting for higher spot prices, or consumption as a result of increased volatility. motivation.
On-chain and exchange activity
Evaluating Bitcoin’s on-chain activity can provide important information about the network’s health, adoption, and growth. However, despite the strong price performance, a counter-intuitive phenomenon occurred as the number of active entities fell to a cycle low of 219,000 per day.
On the surface, this might suggest that despite the massive increase in Bitcoin prices, the growth of Bitcoin users has not kept pace.
This is primarily due to increased activity related to ordinal and inscriptions, with many participants reusing Bitcoin addresses, thus reducing the number of "active entities" (not double counting).
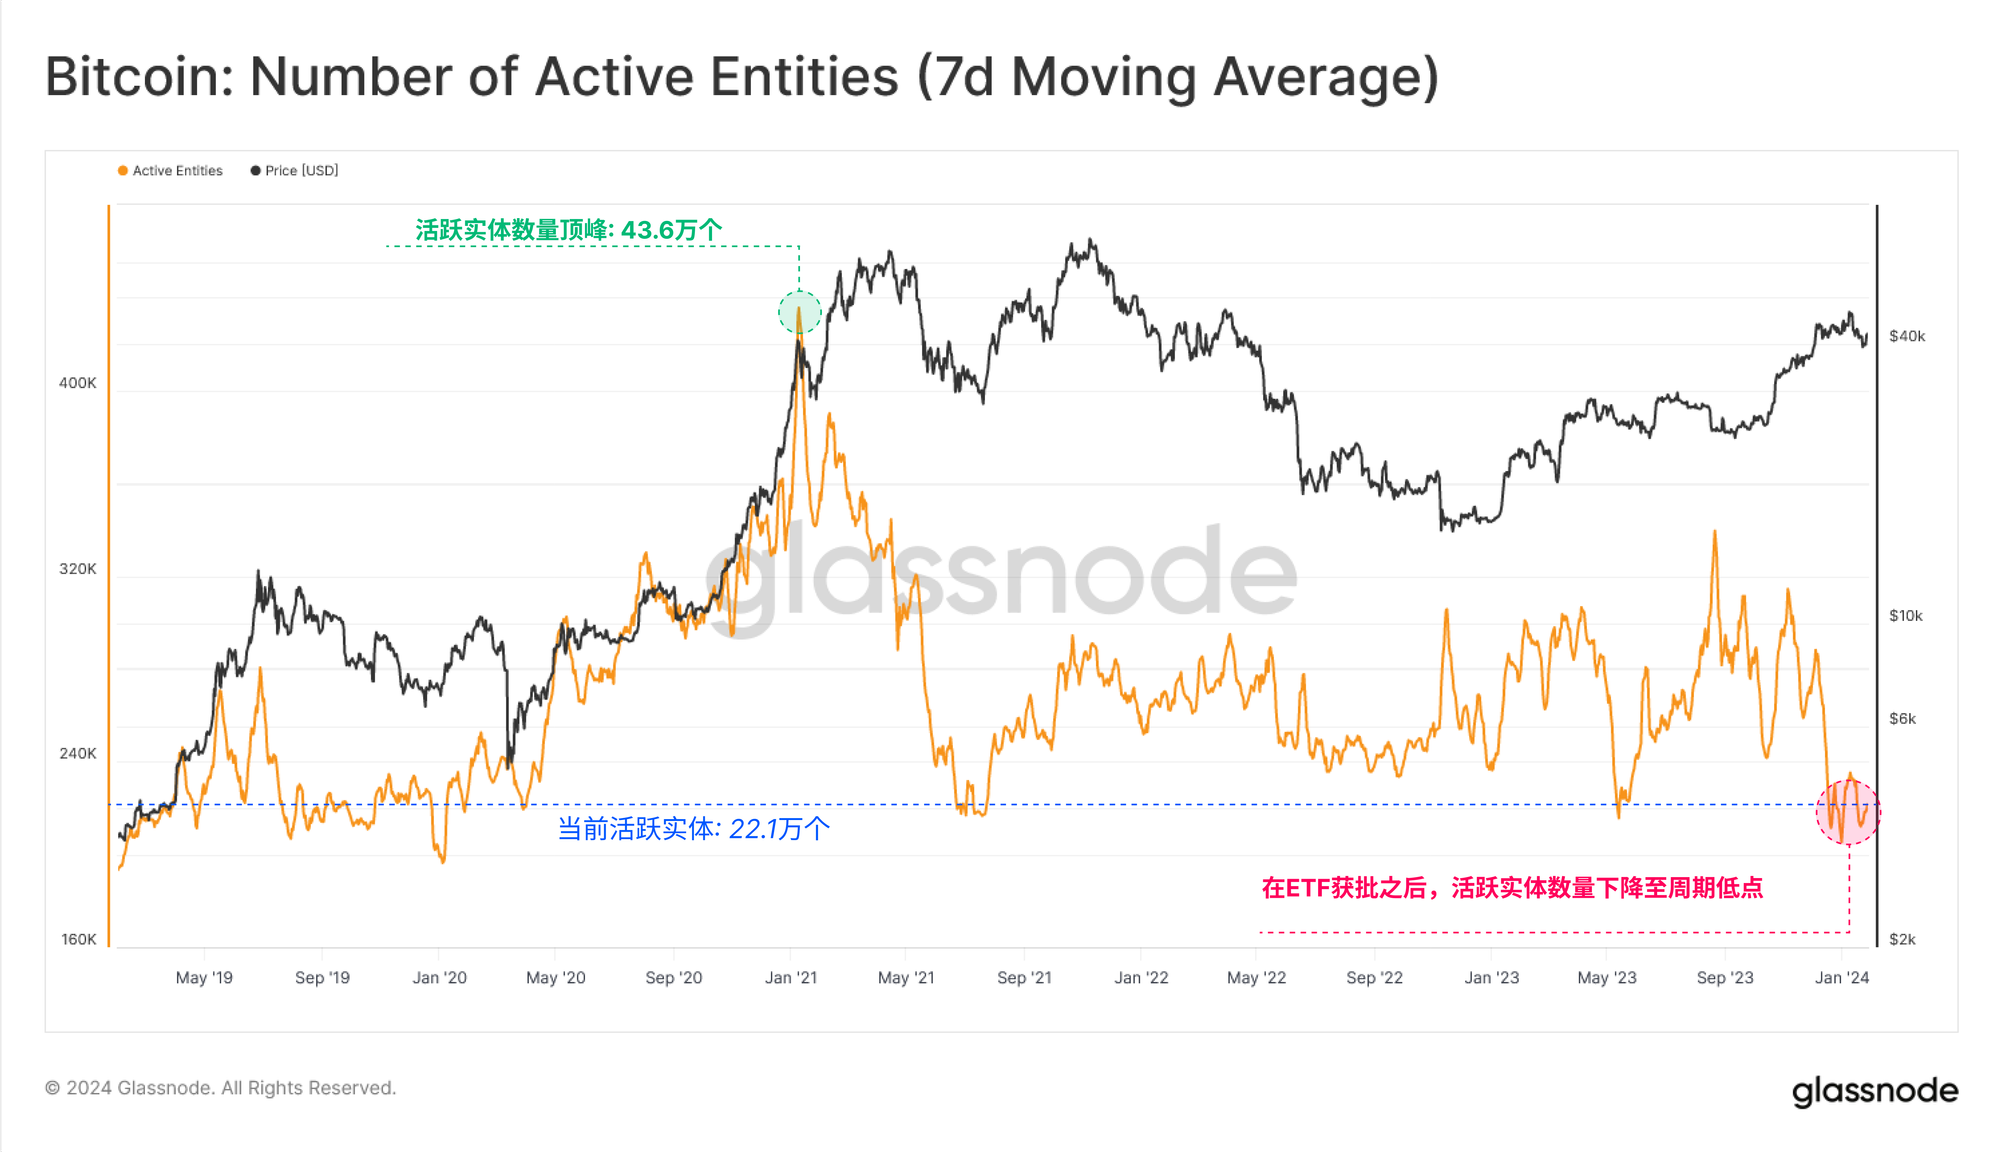
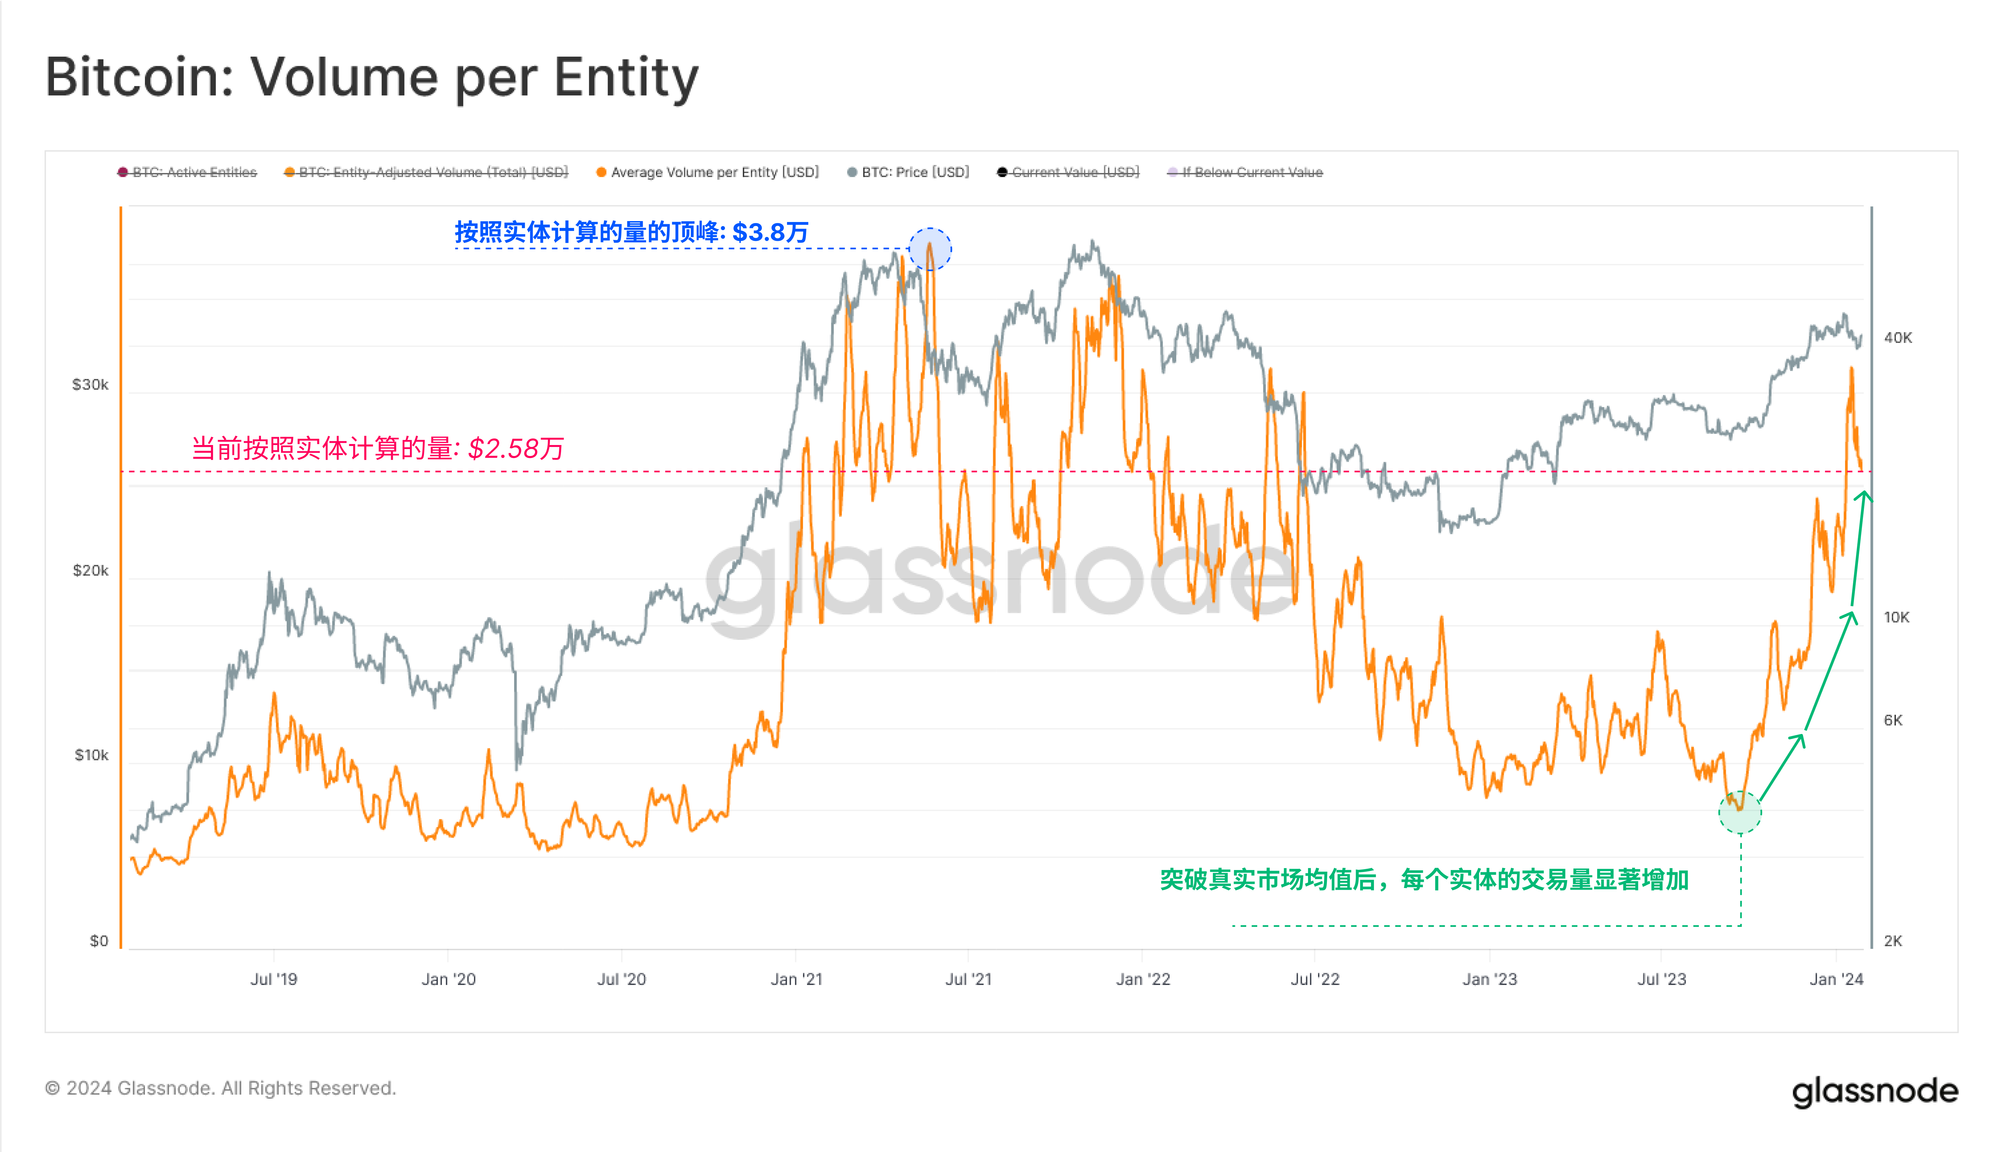
Transfer volumes, on the other hand, remain very strong, with approximately $7.7 billion in economic transactions processed daily. The disparity between active entities and growing transfer volume highlights the increase in large entities active in the market, with the average transaction volume per entity soaring to $263,000 per transaction.
This indicates that institutional investors and capital flows are increasing.
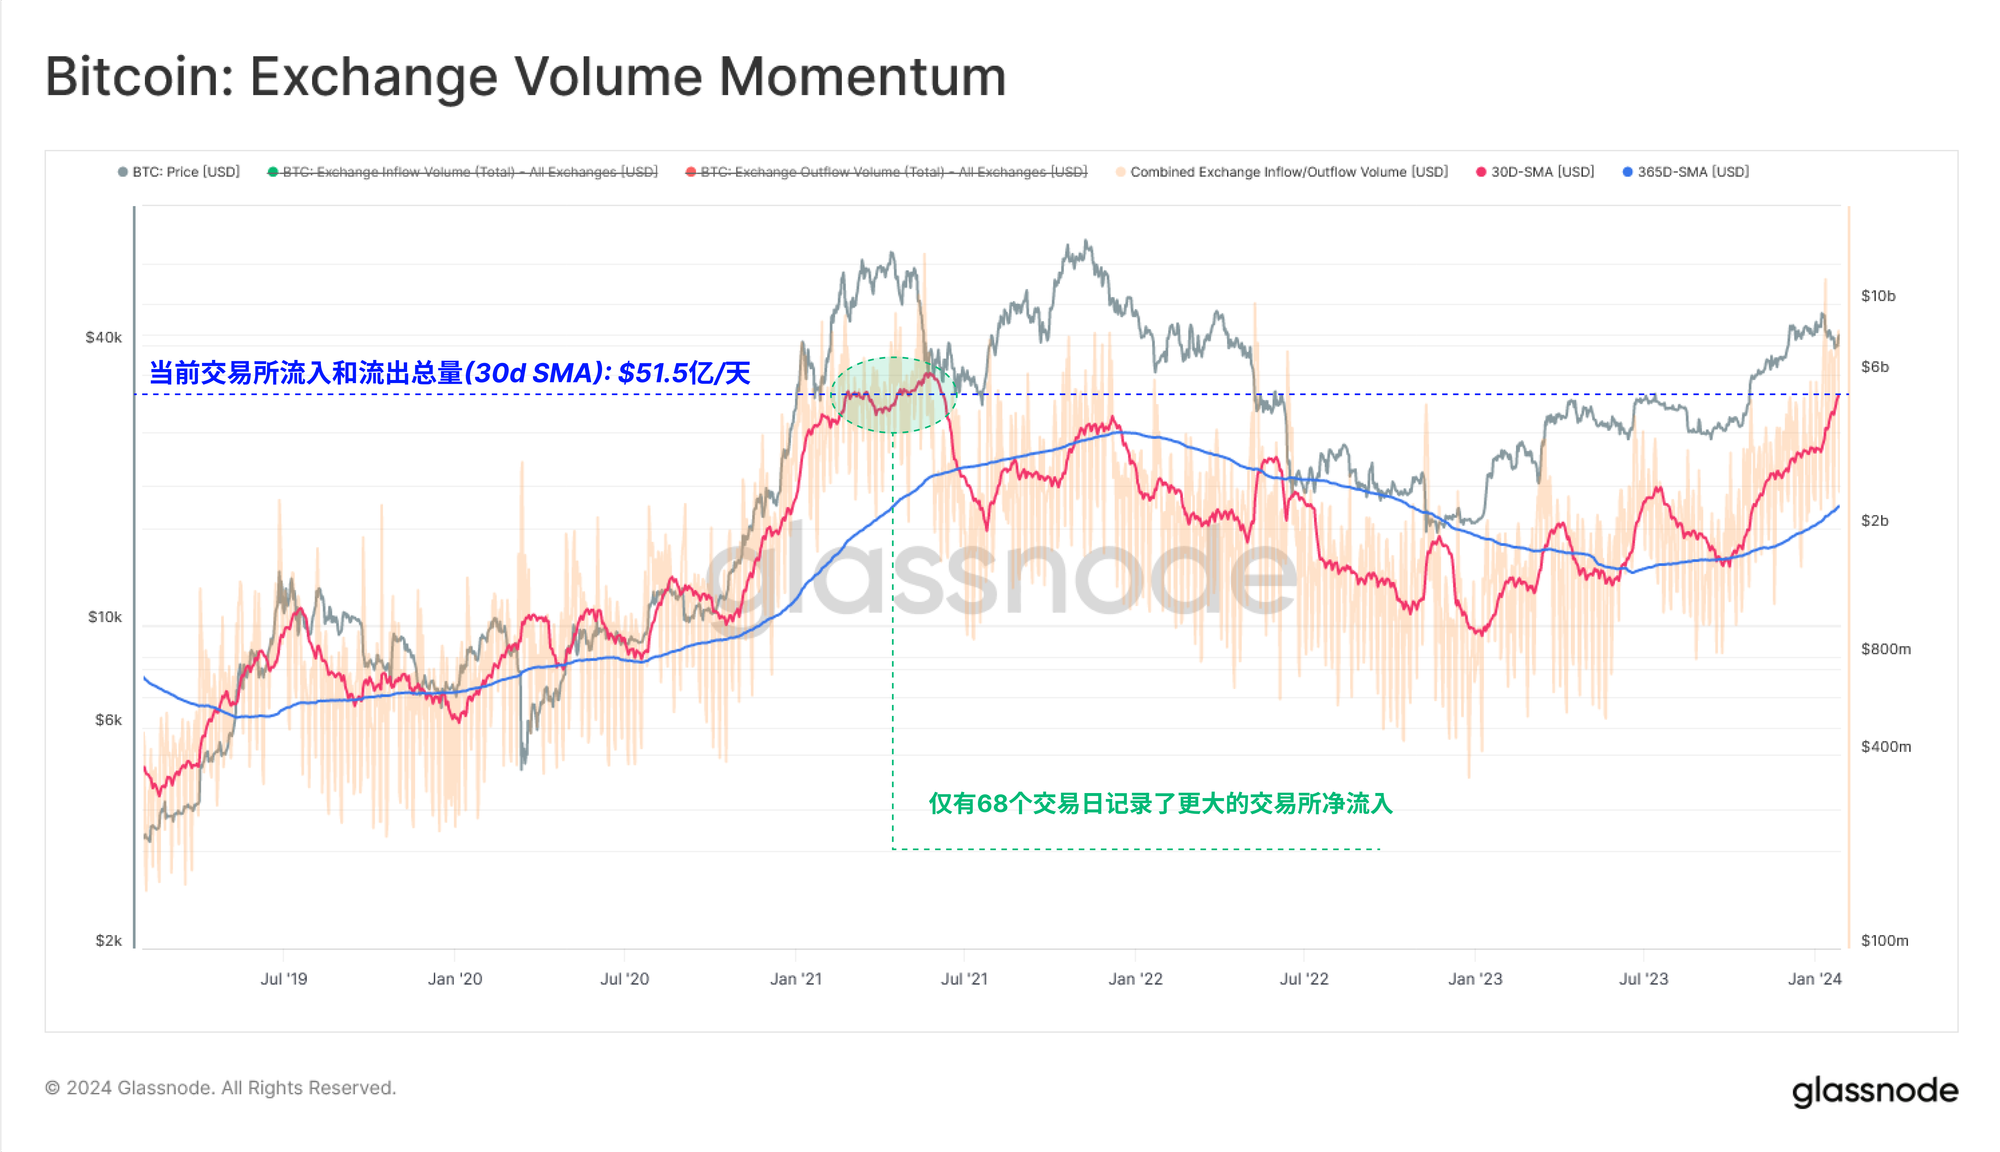
Exchanges continue to be the main venue for trading activity, with deposit and withdrawal volumes growing significantly, reaching $6.8 billion per day. Currently, exchange-related deposit and withdrawal activity accounts for approximately 88% of all on-chain transaction volume.
The current trading volume in and out of exchanges is comparable to the peak during the 2021 bull market, with only 68 trading days (1.5%) with trading volume above the peak (based on the 30D-SMA method).
This once again highlights market participants’ growing interest in Bitcoin.
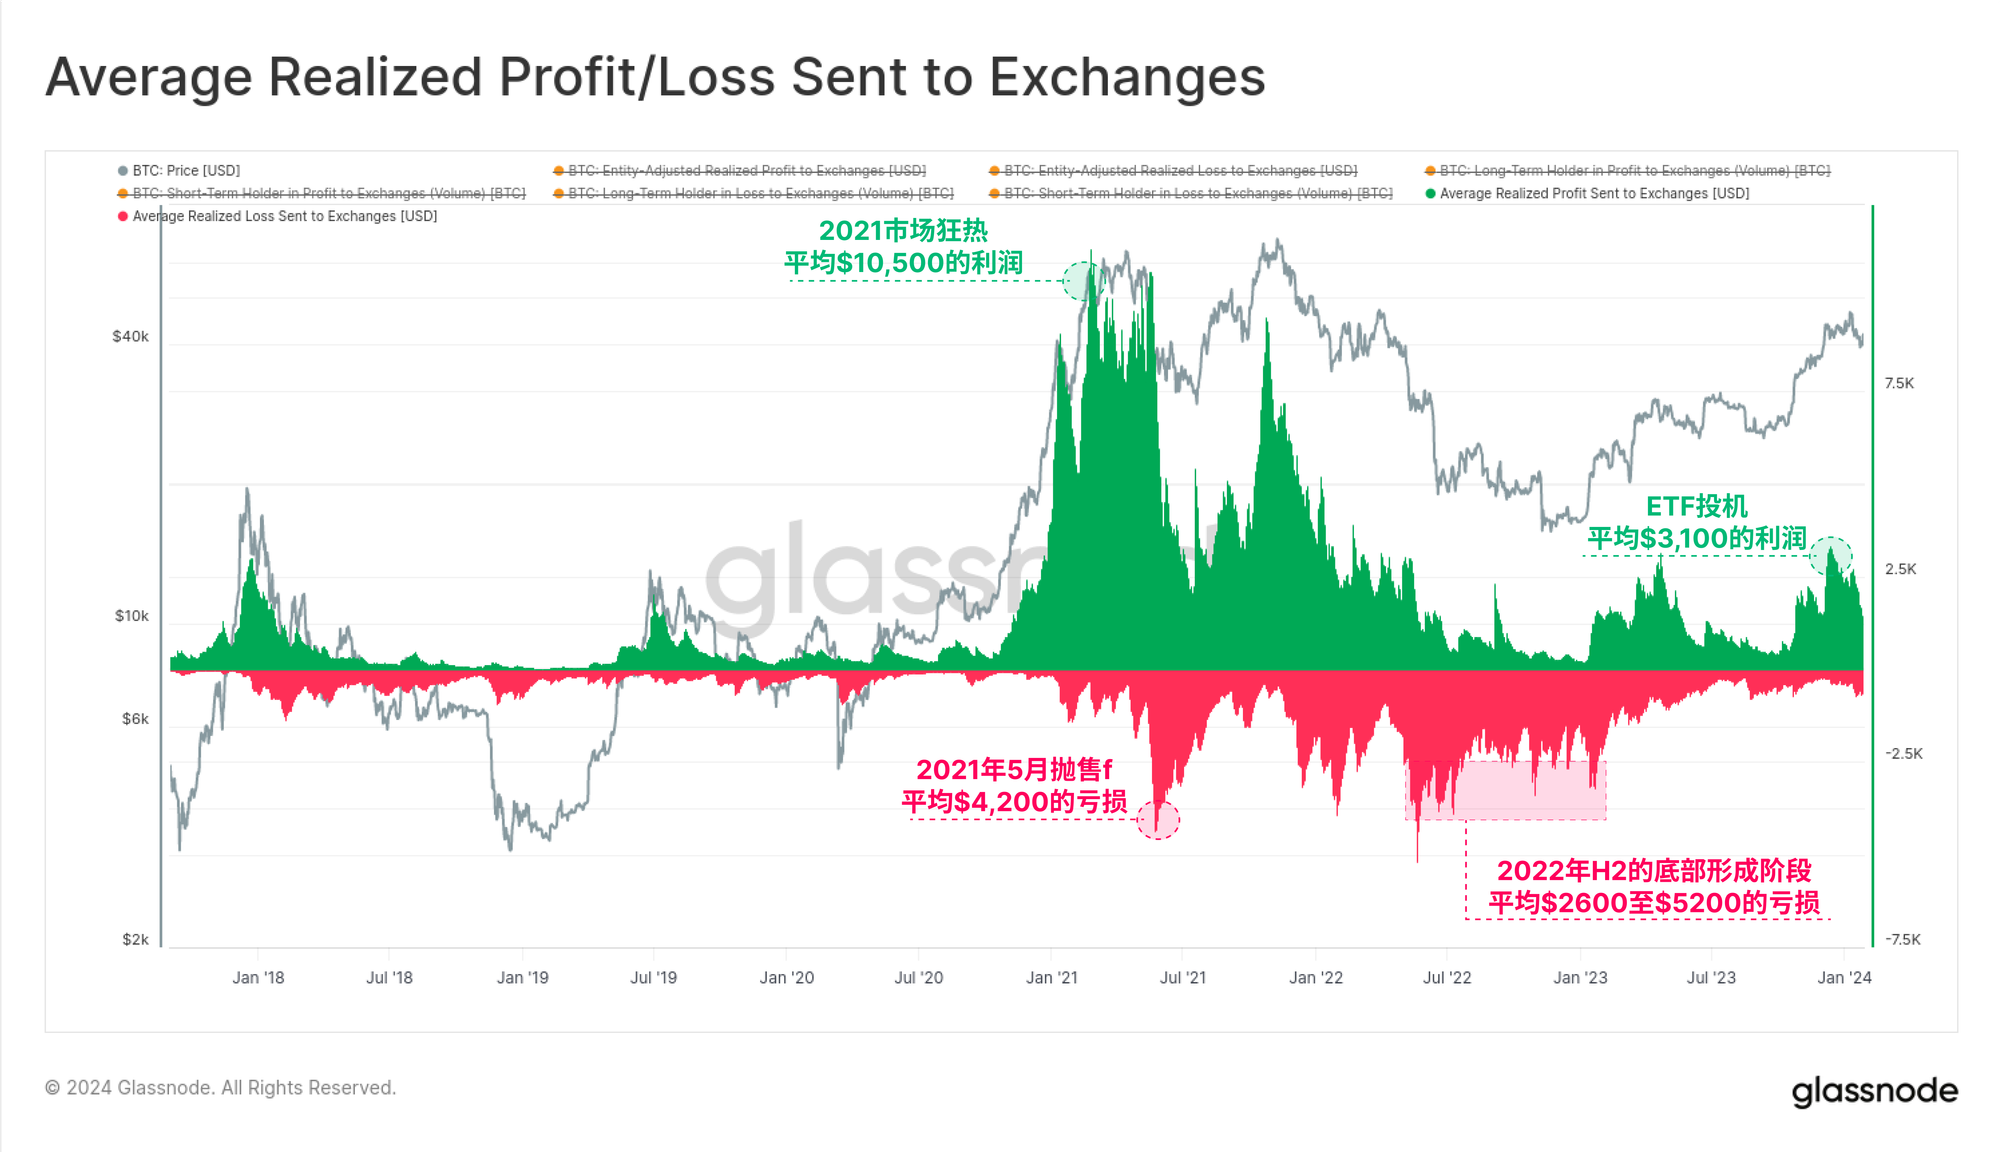
While exchange traffic increased, profit-taking also occurred. The chart below shows the average profit (or loss) for each currency on the exchange.
At the height of ETF speculation, this metric reached an average profit of $3,100, a level reached at the peak of the April 2023 rally. That's still a far cry from the $10,500 average profit seen at the top of the 2021 bull market, and it's starting to cool off meaningfully.
in conclusion
The approval of nine spot Bitcoin ETFs is a milestone for the digital asset, with institutional funds openly flowing into the asset class. Capital inflows are currently accelerating as investors rebalance into the long-questioned GBTC ETF product, despite a severe oversupply problem.
The value of on-chain exchange flows has also reached the peak of the 2021 bull market, and the average size of transfer value is showing the increasing presence of institutional and large capital investors.
The article comes from the Internet:Glassnode chain report: Digesting GBTC excessXiaobai NavigationSupply Impact
相较于完全忽视该资产,在投资组合中配置少量的比特币将会是更为稳妥的选择。 来源:Bloomberg 编译:比推 BitpushNews Yanan 这次的币价反弹证明,即便是对加密货币持怀疑态度的投资者也应该认识到:相较于完全忽视该资产,在投资组合中配置少量的…