Ethereum 2023 in numbers: pledge amount +60%, annual supply -0.28%, 12 L2s TVL average +333%
Written by: Carol, PANews
In 2023, there are two main storylines for Ethereum.
The first line is related to liquidity pledge. In April, Ethereum completed the Shanghai upgrade and officially opened pledge withdrawals, entering the era of "interest rate regulation". However, contrary to the market's earlier concerns, the Ethereum upgrade not only did not cause large-scale selling pressure, but attracted more deposits as the price of the currency rose, and LSD became the hottest DeFi track.
第二条线与 Layer2(下文简称 L2)有关。Arbitrum 的空投不仅又一次续写了「造富神话」,还拉高了其他 L2 空投的预期。另外,随着 Base 的一炮而红和坎昆升级的临近,模块化、并行 EVM、数据可用性(DA)、去中心化排序器等技术关键词正变得随处可见。L2 快速发展,OP 等代表资产的价格快速上涨,这些都让 L2 成为 2024 年最受期待的领域。
PAData, a data news column under PANews, analyzed the data of liquidity pledge and L2 in 2023 to review and look forward to the development of Ethereum:
-
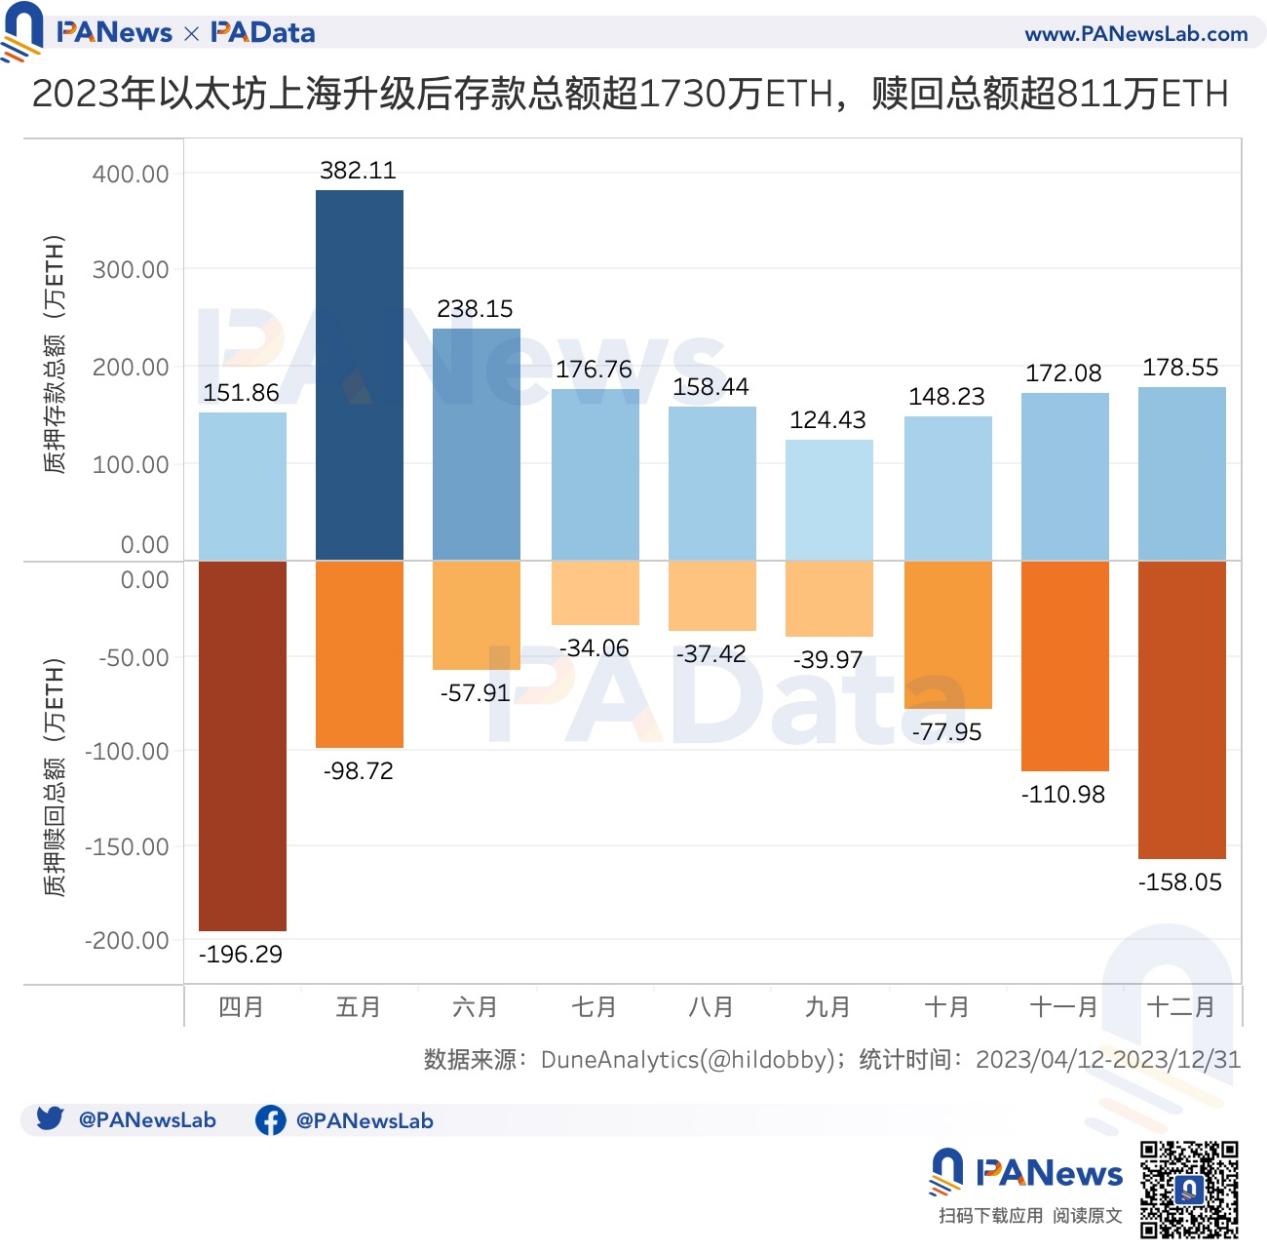
From the Shanghai upgrade to the end of the year, the total amount of Ethereum deposits was about 17.3061 million ETH, and the total amount of redemptions was about 8.1135 million ETH. The cumulative total amount of pledged increased by 10.8242 million ETH, an increase of about 60%, but the growth rate of pledged assets declined rapidly. This means that people are no longer as keen on staking deposits as in the past.
-
Will Ethereum's staking deposits squeeze out other DeFi activities? The results of the correlation analysis show that in a small cycle, when the price clearly drops, more funds flow from DeFi to staking deposits, and Ethereum staking activities may have a "siphoning" effect; when the price clearly rises, funds flow out of both staking activities and DeFi activities, and there is no reverse "siphoning".
-
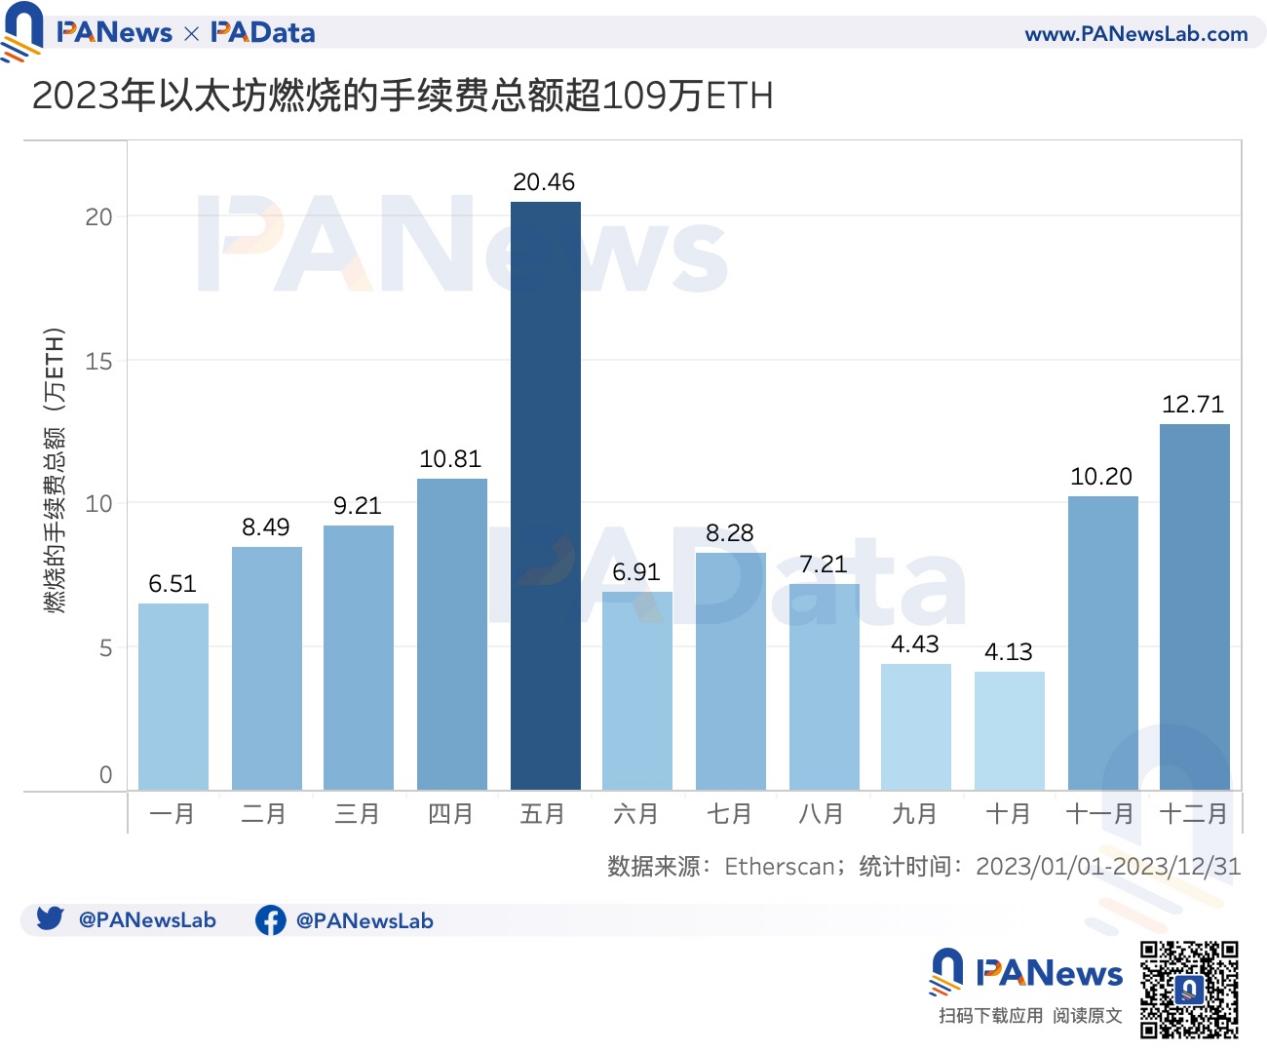
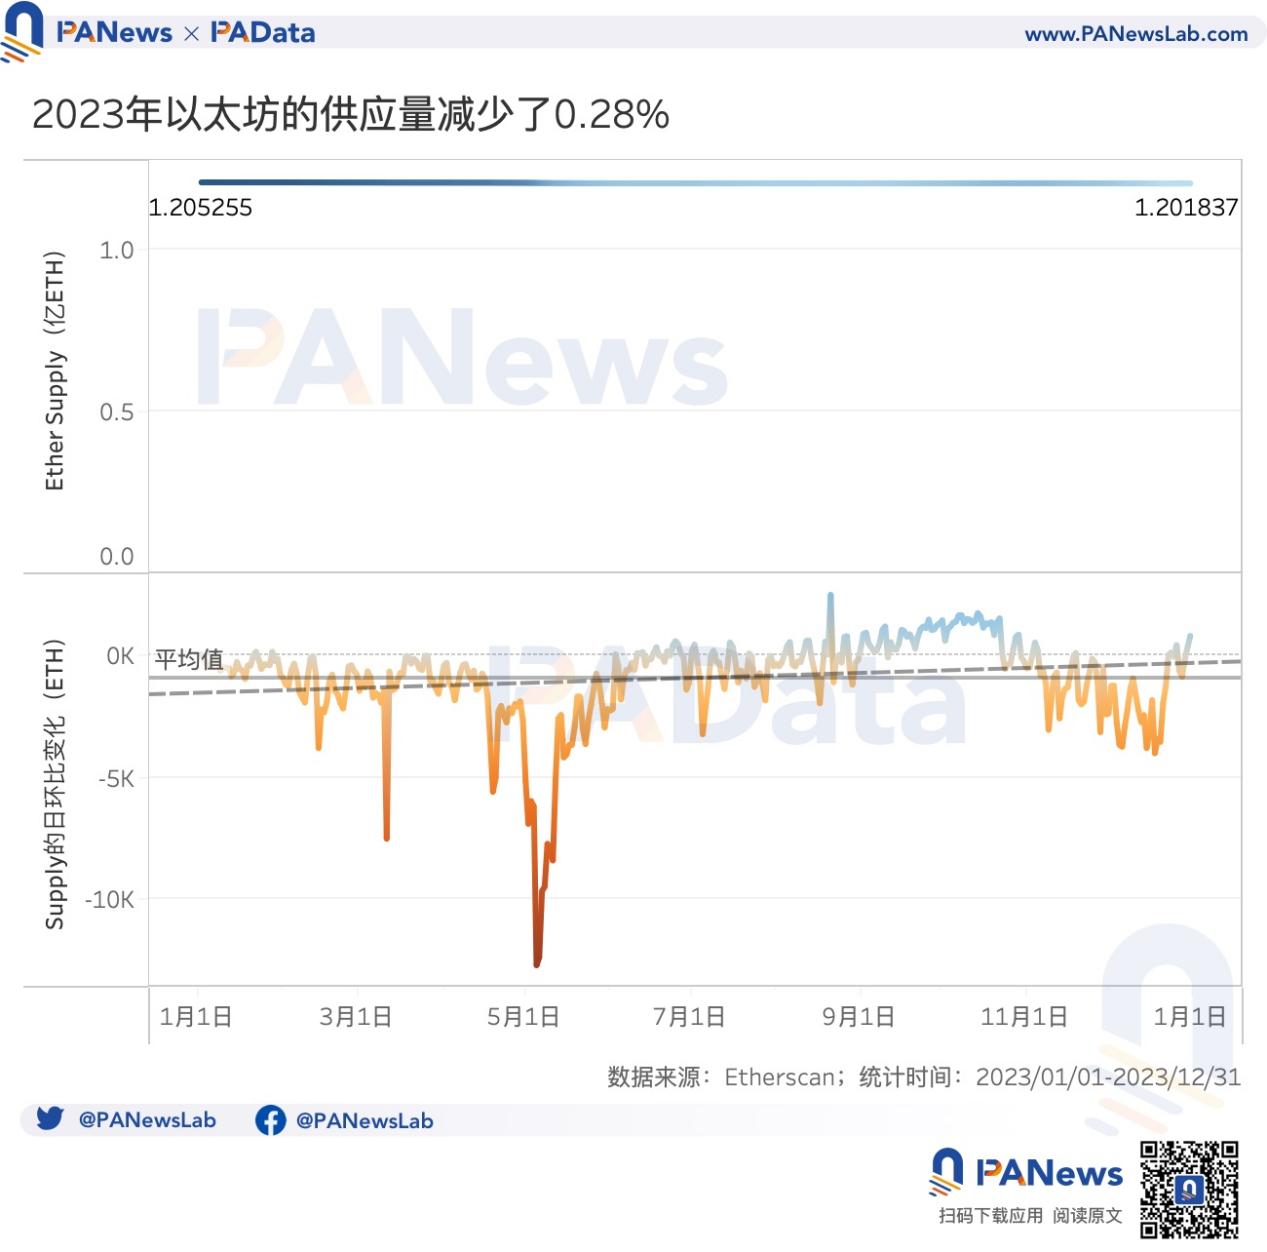
In 2023, the total amount of fees burned by Ethereum is about 1.0935 million ETH. The supply has decreased by about 341,800 ETH, a decrease of about 0.28%. ETH has achieved a slight deflation overall, but the magnitude and trend of deflation are not significant.
-
Looking at the basic situation of the 34 L2s, 11 each use Optimistic Rollup and ZK Rollup. Most of them are in the early stages of technology, and 17 are in the STAGE 0 stage that only implements the state submission function. Including the popular OP Mainnet, Base, zkSync Era, Starknet, etc.
-
Arbitrum One has the highest TVL in L2, reaching $9.37 billion, followed by OP Mainnet, reaching $6.05 billion. Manta Pacific, Starknet, and Polygon zk EVM have seen the highest increase in TVL this year.
-
Arbitrum One had the most cumulative transactions in 2023, exceeding 275 million times. The second was zkSync Era, exceeding 218 million times. Both of them once exceeded Ethereum in TPS at the end of the year.
-
In 2023, the number of independent addresses and daily active addresses of L2 increased significantly. Base had the highest annual increase in independent addresses, with an increase of more than 71,66%. Mantle had the highest annual increase in daily active addresses, with an increase of more than 8,86%.
-
Among the four major Rollup L2s, zkSync Era has the highest annual revenue, reaching $22.26 million, followed by Arbitrum, reaching $16.53 million. Base and Optimism both have less than $6 million.
-
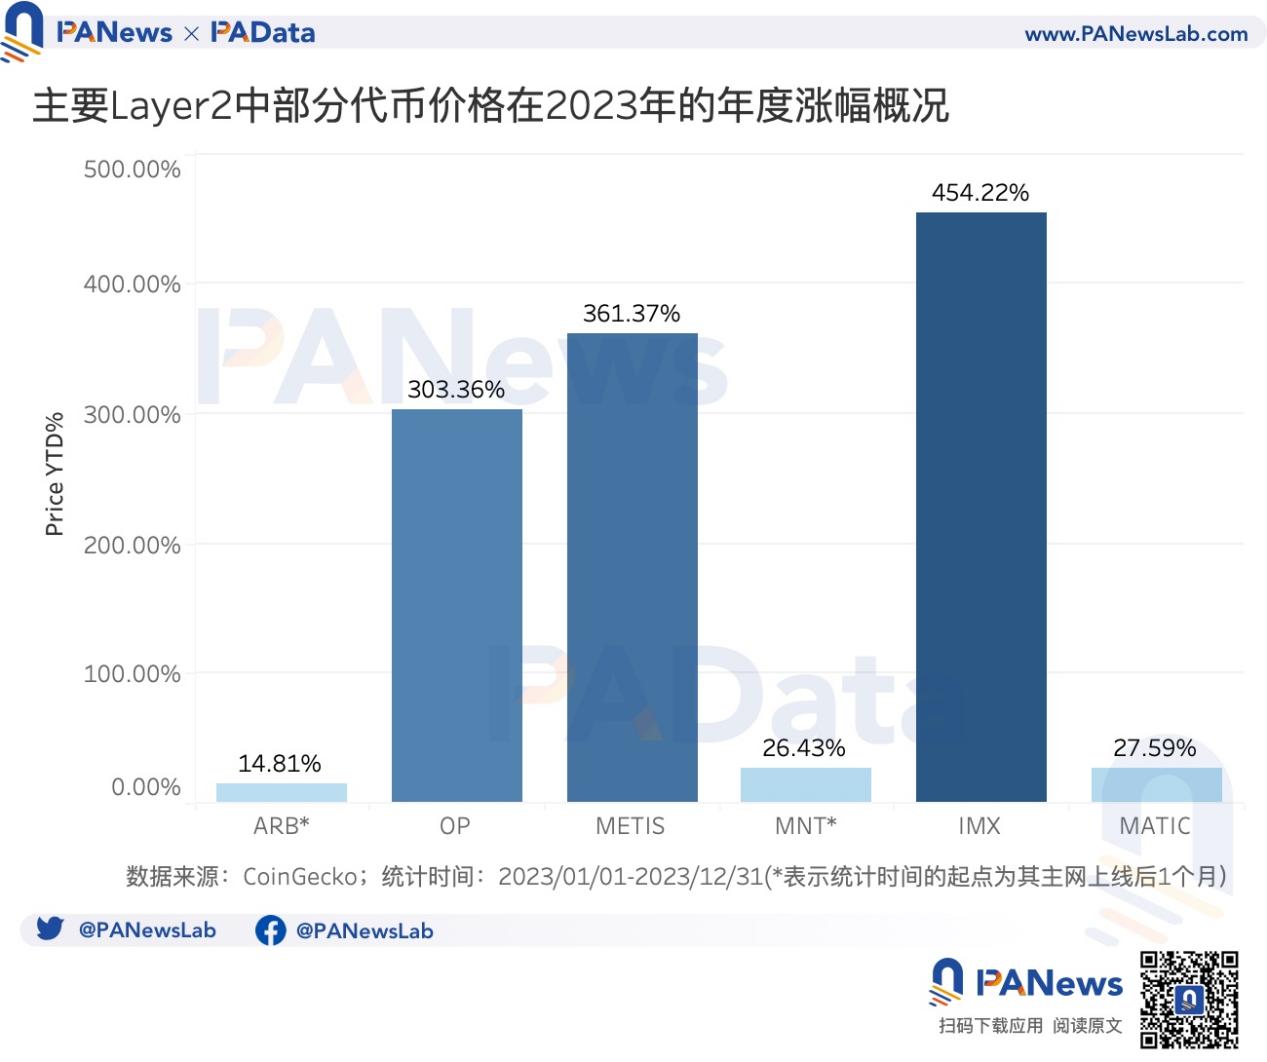
In 2023, IMX had the highest price increase, up more than 454%, followed by METIS and OP, both up more than 300%. However, the price of ARB was mediocre, with an increase of only 14.81% throughout the year.
01. After the Shanghai upgrade, the total amount of pledged tokens increased by nearly 60%, but the growth rate declined. The total amount burned for the whole year exceeded 1.09 million ETH, achieving deflation
Since Ethereum successfully completed the Shanghai upgrade on April 12, the total deposit amount was about 17.3061 million ETH, and the total redemption amount (including Principal and Rewards redemption) was about 8.1135 million ETH. Among them, the total redemption amount showed an inverted "U" shape, with higher amounts in April and December, exceeding 1.96 million ETH and 1.58 million ETH respectively. The total deposit amount was basically stable. Except for 3.82 million ETH attracted in May, the total deposit amount in other months was about 1.68 million ETH.
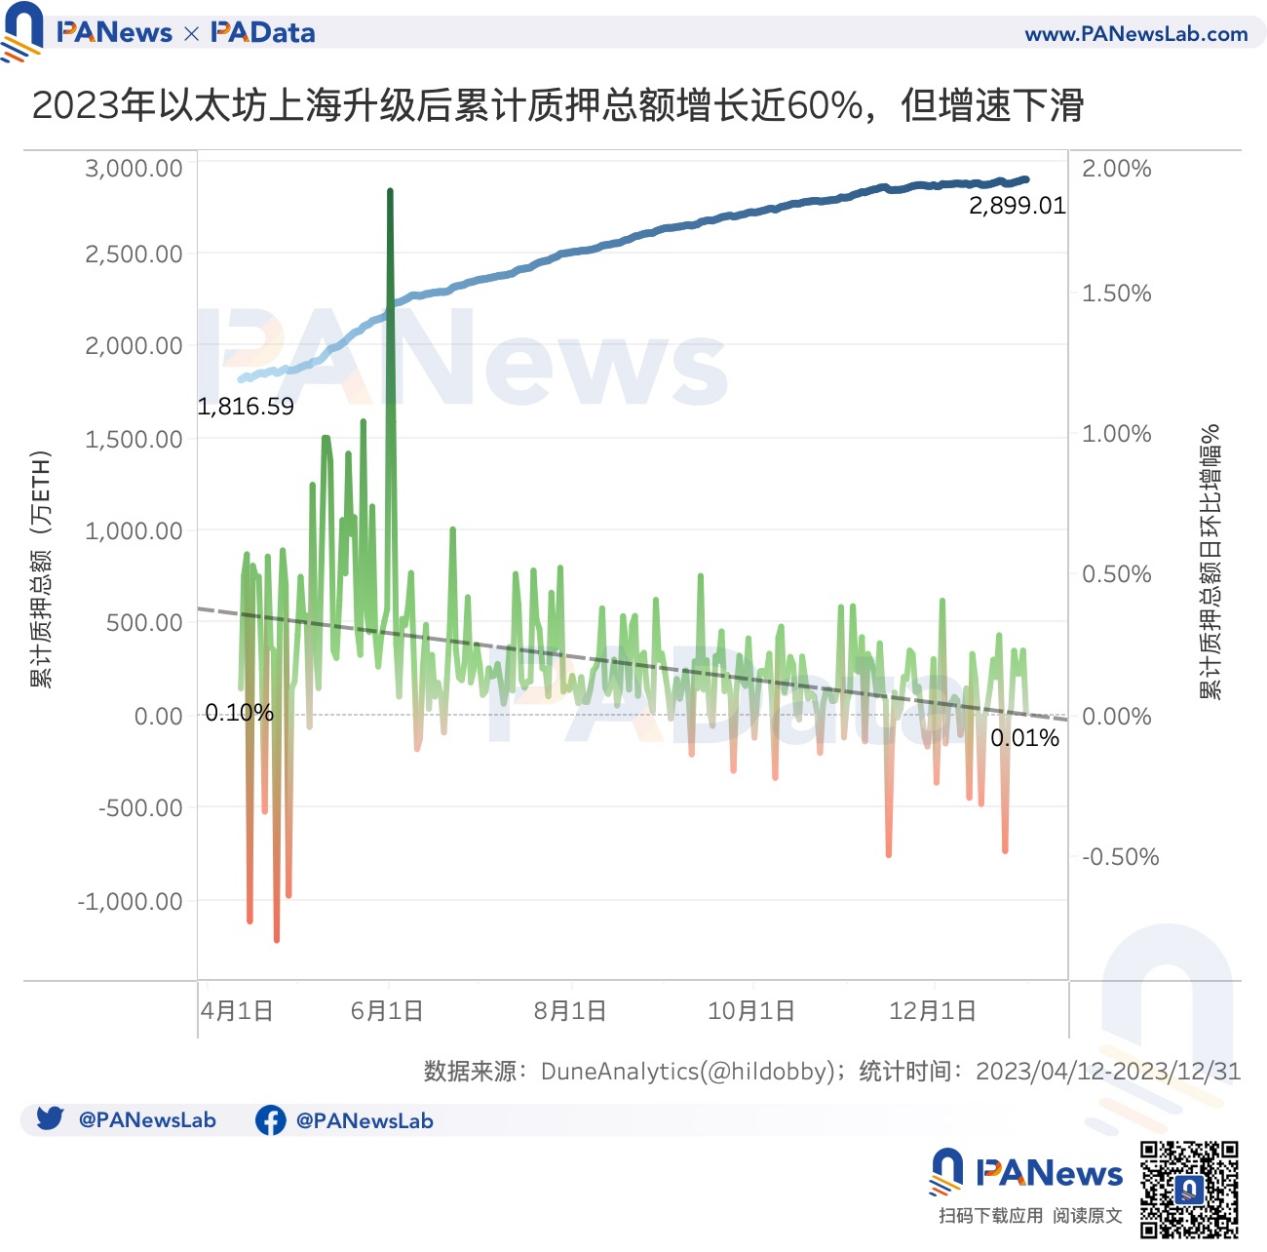
After the Shanghai upgrade, the total amount of pledged assets increased from 18.1659 million ETH to 28.9901 million ETH, with an increase of 10.8242 million ETH and an increase of approximately 60%.
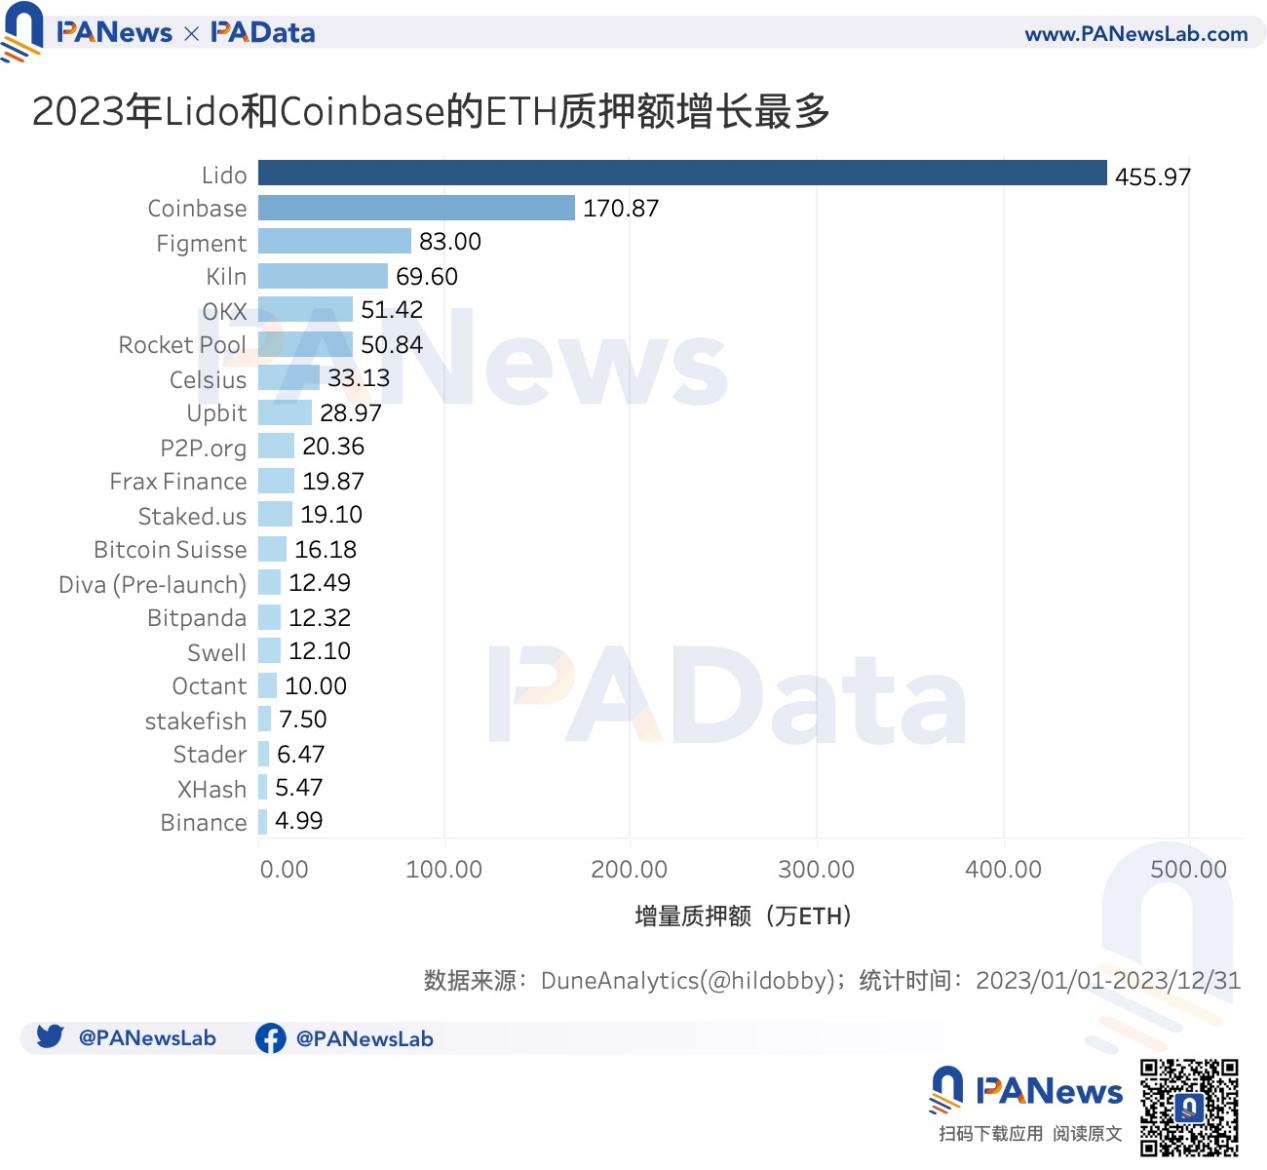
From the perspective of staking entities, Lido and Coinbase are the two entities with the largest increase in total staking amount in 2023, with an increase of 4.5597 million ETH and 1.7087 million respectively, while the increase of other entities is less than one million ETH. Among them, the total staking amount of Figment, Kiln, OKX and Rocket Pool increased by more than 500,000 ETH, which is a relatively large increase.
However, judging from the data for the whole year, the growth rate of the total amount of Ethereum pledged is declining rapidly. In May, the average daily month-on-month growth rate of the cumulative total amount of pledged reached a peak of 0.48%, but since then, the value has declined month by month, and by December, it has dropped to 0.03%, with a very obvious downward trend. This means that people are no longer as keen on staking deposits as in the past.
According to DuneAnalytics data, although the staking rate of Ethereum has dropped from 4.18% at the beginning of the year to 3.09% at the end of the year, it is still a stable financial income. There has always been a voice that Ethereum's high staking rate may attract more deposits, thereby squeezing out other on-chain activities and affecting the long-term development of the Ethereum ecosystem. So from the data performance, is this assumption valid?
PAData counted the correlation between the daily month-on-month change in the total amount of pledged assets after the Shanghai upgrade and the daily month-on-month change in TVL, and also counted the correlation between the daily month-on-month change in the total amount of redemptions and the daily month-on-month change in TVL. Here, TVL is denominated in ETH, and according to DefiLlama's definition, TVL does not include the locked amount of the liquidity pledge agreement.
If the daily year-on-year change in the total amount of stake is negatively correlated with the daily year-on-year change in TVL (≤-0.5), or the daily year-on-year change in the total amount of redemptions is positively correlated with the daily year-on-year change in TVL (≥0.5), that is, when a higher daily year-on-year increase in the total amount of stake occurs at the same time as a lower daily year-on-year increase in TVL, or a higher daily year-on-year increase in the total amount of redemptions occurs at the same time as a higher daily year-on-year increase in TVL, it can be considered that there is a "siphon effect" in Ethereum staking activity, and vice versa.

The results of the correlation analysis show that, overall, there is no evidence that there is a "siphon effect" in Ethereum staking activities.
However, if the time period is shortened to weekly, there may be a "siphon effect" in Ethereum staking activities during some time periods. For example, in mid-to-early August (August 6 to August 19), the correlation coefficient between the daily month-on-month change in the total redemption amount and the daily month-on-month change in TVL was 0.671, and the correlation coefficient between the daily month-on-month change in the cumulative total pledged amount and the daily month-on-month change in TVL was -0.533. At that time, the weekly average price of ETH fell from US$1,844 to US$1,659. This shows that when the price clearly drops, more funds flow from DeFi to pledged deposits, and Ethereum staking activities may have a "siphoning" effect.
Another typical period occurred in mid-to-late October (October 15 to October 28), when the correlation coefficient between the daily month-on-month change in the total amount of staking and the daily month-on-month change in TVL was 0.708, and the correlation coefficient between the daily month-on-month change in the total amount of redemption and the daily month-on-month change in TVL was -0.579. At that time, the weekly average price of ETH rose from US$1,583 to US$1,765. This shows that when the price clearly rises, funds flow out of staking activities and DeFi activities at the same time, and there is no reverse "siphoning".
One of the important pre-order changes of the Shanghai upgrade is the implementation of EIP1559, which makes it possible for Ethereum to achieve deflation. In 2023, the total amount of fees burned by Ethereum was about 1.0935 million ETH. Among them, 204,600 ETH were burned in May, which was the month with the most burning in the whole year; 41,300 ETH were burned in October, which was the month with the least burning in the whole year. At the end of the year, the burning amount rose again to more than 100,000 ETH.
Under such circumstances, the supply of ETH in 2023 will drop from 120.53 million ETH to 120.18 million ETH, a decrease of about 341,800 ETH, a decrease of about 0.28%. In other words, ETH will achieve a slight deflation overall in 2023.
From the perspective of daily month-on-month changes, the supply in 2023 will decrease by an average of 939 ETH per day. In terms of trend, the magnitude of the daily month-on-month change in supply is decreasing. In other words, it can be understood that the deflation trend is very weak and not significant.
02. The average TVL of 12 L2s increased by more than 333% throughout the year, and the total revenue of zkSync Era was 22.26 million US dollars
2023 is a year of rapid development in the L2 field. Not only has OP Stack occupied most of the market, but also there have been a variety of new technology trends such as modular development, parallel EVM, decentralized sequencer, and third-party DA solutions. The blueprint seems to be coming out, so what is the actual development of L2?
From the basic situation of 34 L2s counted by L2BEAT, 11 of them adopted Optimistic Rollup and ZK Rollup, which is equal in number. Another 8 adopted Validium and 4 adopted Optimium. The main difference between different technical architectures lies in the choice of different combinations of data availability (DA) and proof systems.
Most of these L2s are general-purpose, with only a few being dedicated to Exchange or NFT, such as dYdX v3 and Immutable X.
Among these L2s, most are in the early stages of technology. A total of 17 L2s are at STAGE 0, including popular OP Mainnet, Base, zkSync Era, Starknet, etc. Only 3 L2s have reached STAGE 1, including Arbitrum One, dYdX v3, and zkSync Lite.
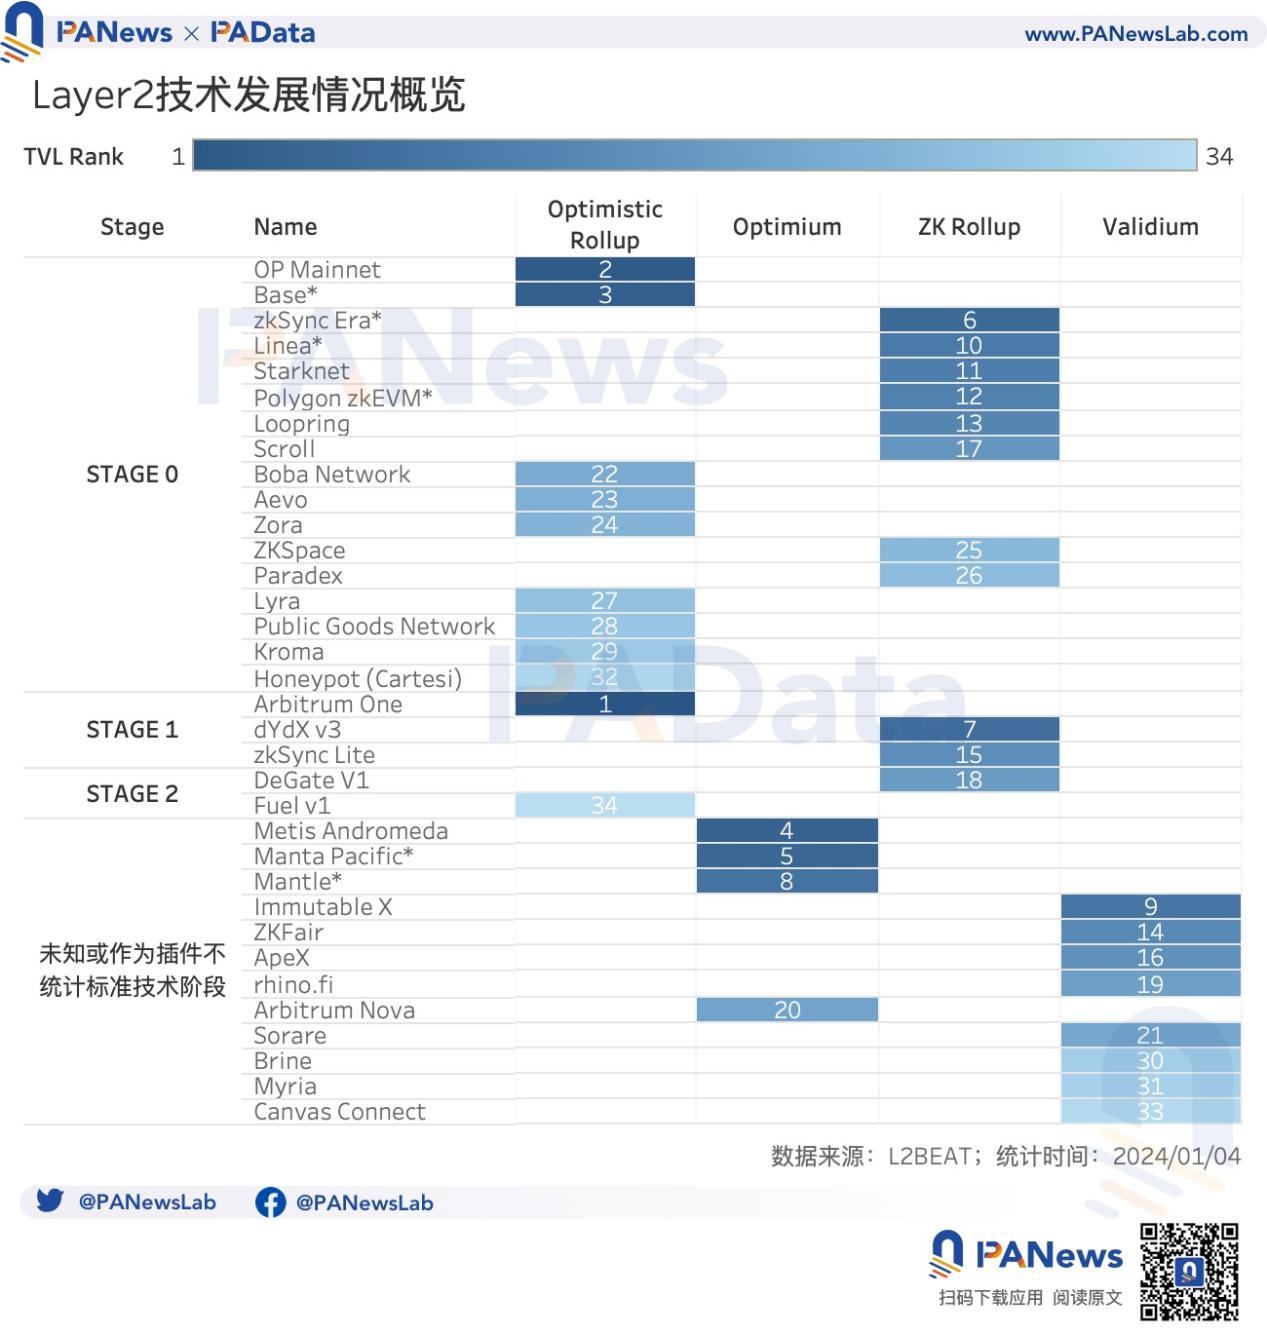
From a technical point of view, the main difference between STAGE 1 and STAGE 0 is that STAGE 1 implements the submission of status to L1 and partially implements the proof system, including that users can exit based on a certain review procedure and can exit within 7 days after unnecessary upgrades are made by participants more centralized than the Security Council.
In addition, there are 2 L2s that have reached the higher STAGE 2. The main technical difference between them and STAGE 1 is that STAGE 2 further improves the proof system, including that fraud proof submission is only open to whitelist participants, upgrades that are not related to provable vulnerabilities on the chain provide an exit time of less than 30 days, and the Security Council's actions are not limited to provable vulnerabilities on the chain.
Currently, the L2 with the highest TVL (the total value locked in Ethereum escrow contracts, which may include external bridges and locally created assets) is Arbitrum One, which has reached $9.37 billion, followed by OP Mainnet, which has reached $6.05 billion. Apart from these two, the TVL of other L2s does not exceed $700 million. The market share of L2 is basically shared by Arbitrum One and OP Mainnet.
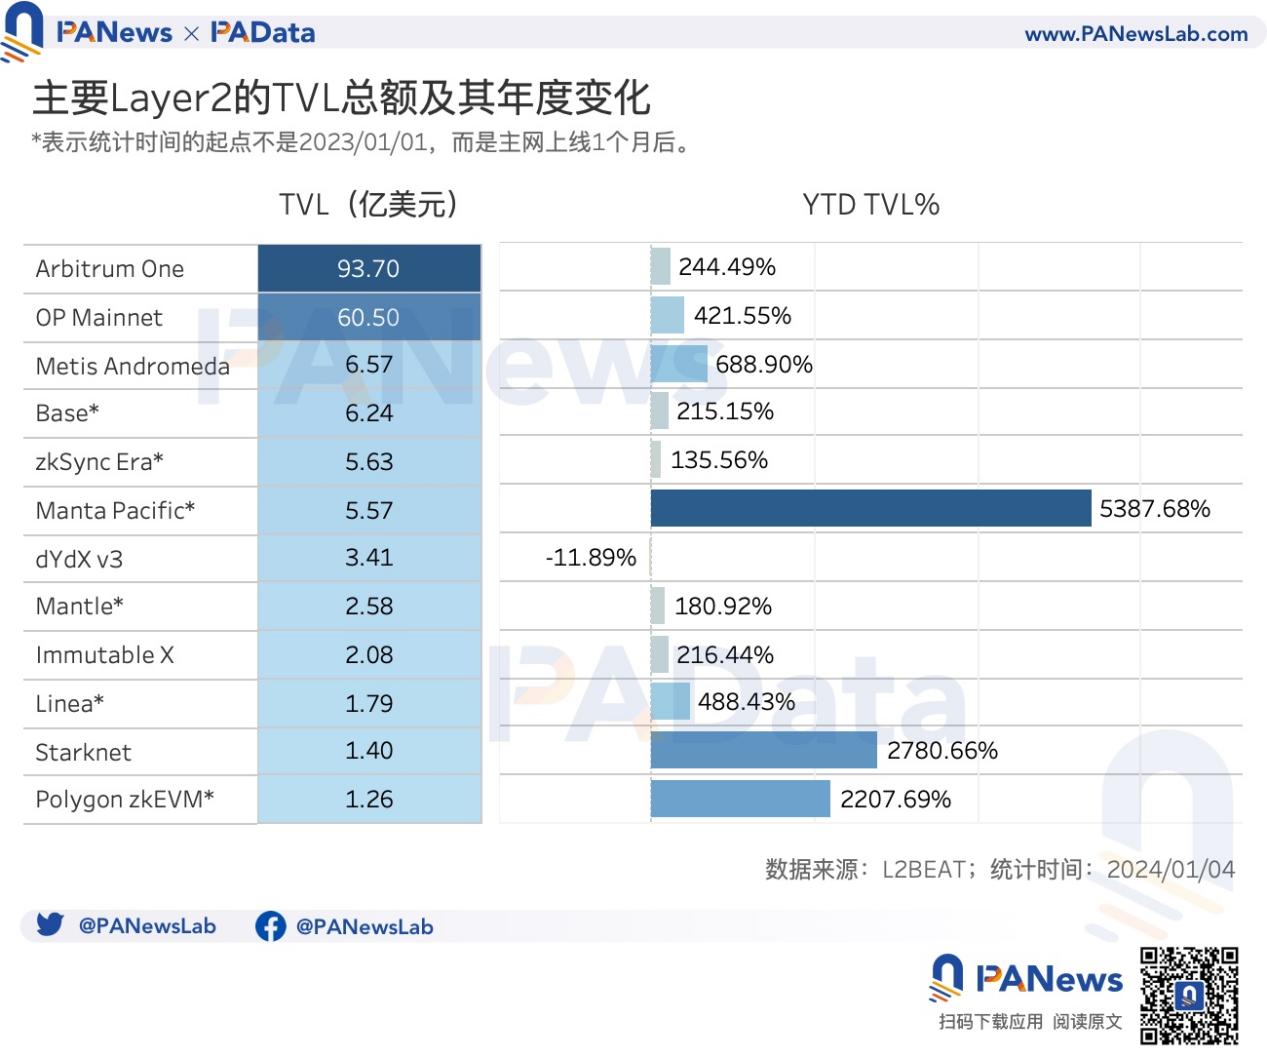
However, in 2023, there are still many "new faces" in the L2 market besides the two giants. Among the 12 L2s with the highest TVL, 6 of them will release their mainnet in 2023, accounting for as much as half. These new L2s took advantage of the situation and achieved a relatively high TVL growth during the year. For example, the TVL of Manta Pacific increased by more than 53,87%, and the TVL growth of Starknet and Polygon zk EVM both increased by more than 20,00%.
Other projects with high TVL growth include Metis Andromeda and Linea, which exceeded 688% and 488% respectively. In addition, Arbitrum One, OP Mainnet, Immutable X and other early-launchedXiaobai Navigation L2 also achieved a TVL increase that exceeded 200%.
Due to data availability, the subsequent analysis of on-chain data is limited to some L2s with higher TVL.
In terms of transaction times, Arbitrum One had the most transactions in 2023, exceeding 275 million times. The second was zkSync Era, exceeding 218 million times. OP Mainnet also exceeded 136 million times. The cumulative transaction times of L2 in other statistical ranges were less than 100 million times, and some were even less than 10 million times.
It is worth noting that, influenced by the inscription craze, Arbitrum One and zkSync Era surpassed Ethereum in TPS at the end of the year and withstood the test of high-frequency interactions.

From the perspective of user scale, L2 within the statistical scope has achieved very significant growth in 2023. Base has the highest annual increase in independent addresses, with an increase of more than 71,66%, followed by OP Mainnet, with an increase of more than 36,83%. Mantle has the highest annual increase in the number of daily active addresses, with an increase of more than 8,86%, followed by Metis Andromeda, with an increase of more than 4,55%. Overall, this means that not only are more people starting to use L2, but they are also using it more frequently.
Although the development of L2 is promising, its fund scale and user scale are still relatively limited at present, which reflects the low income of L2 in terms of revenue. After statistics on the income of the four major Rollup L2s, it was found that zkSync Era had the highest annual income, reaching 22.26 million US dollars, followed by Arbitrum, reaching 16.53 million US dollars. Base and Optimism both have less than 6 million US dollars.
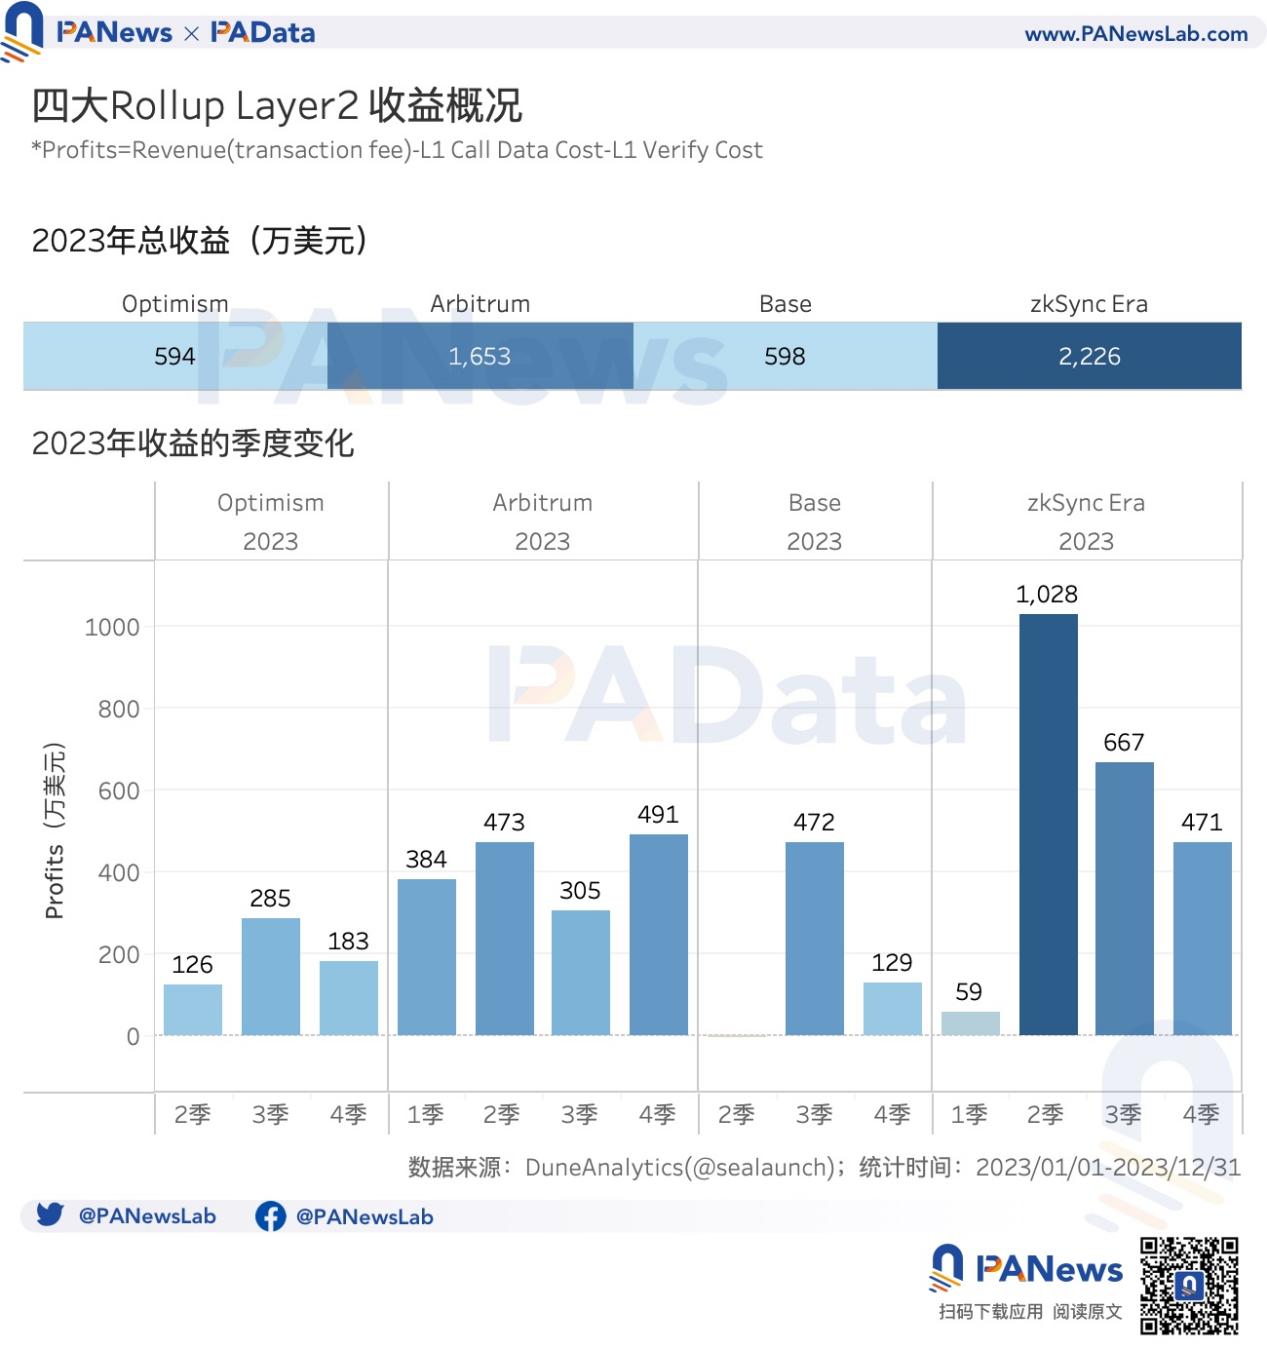
Moreover, L2's revenue is not synchronized with its transaction number, because an increase in the number of transactions usually also means an increase in DA costs. For example, zkSync Era's high returns mainly come from the second quarter, rather than the fourth quarter when inscriptions are hot. How to balance the fee income and DA costs may become an important issue that needs to be solved for the future development of L2.
If we map the rapid development of L2 to the performance of coin prices, there are still some differentiation and dislocation.TokenThere are still not many. Among them, IMX had the highest price increase in 2023, up more than 454%, followed by METIS and OP, both up more than 300%. However, despite the outstanding performance of other data of ARB, the price of ARB was mediocre, with an increase of only 14.81% throughout the year, which is lower than MNT and MATIC.
More L2 projects may be launched in 2024TokenHow to balance transaction fee income and DA costs, and how to provide value support for tokens will still be important issues that need to be solved in the future development of L2.
The article comes from the Internet:Ethereum 2023 in numbers: pledge amount +60%, annual supply -0.28%, 12 L2s TVL average +333%
Related recommendations: Mingpai Points Incentive: Summary of 20 Must-Have Projects in 2024
A reasonable points model and strategy is the key to ensure the short- and medium-term sustainable development of the points system. Written by Karen, Foresight News More and more project parties are launching points systems to encourage users to actively participate and improve user retention and loyalty. This is also widely regarded as an effective traffic diversion strategy before the airdrop is released. For users, not…